Beach Comber CLT
DDS
Simulator to Demonstrate CLT
Control Parameters
n = 7 # sample size per sample
simulations = 10000 #number of samples and thus number of xbars we will generate.
mu = 21; # mean parameter for use with normal distribuions
sigma = 7.08; # standard deviation parameter for use with normal distribuions
Data Holder
xbar_holder = numeric(simulations) # This will hold all the sample means.Simulate and Store
Generate 1000 samples each of size 10 and find the mean of each sample. Then store each mean in the xbar_holder vector.
for (i in 1:simulations)
{
  sample = rnorm(n,mean = mu, sd = sigma)
  xbar = mean(sample)
  xbar_holder[i] = xbar
}
display the distribution of sample means (plot a histogram of the sample means)
hist(xbar_holder, col = "blue", main = paste("Distribution of the sample mean: n = ", n), xlab = "Sample Means", xlim = c(10,31))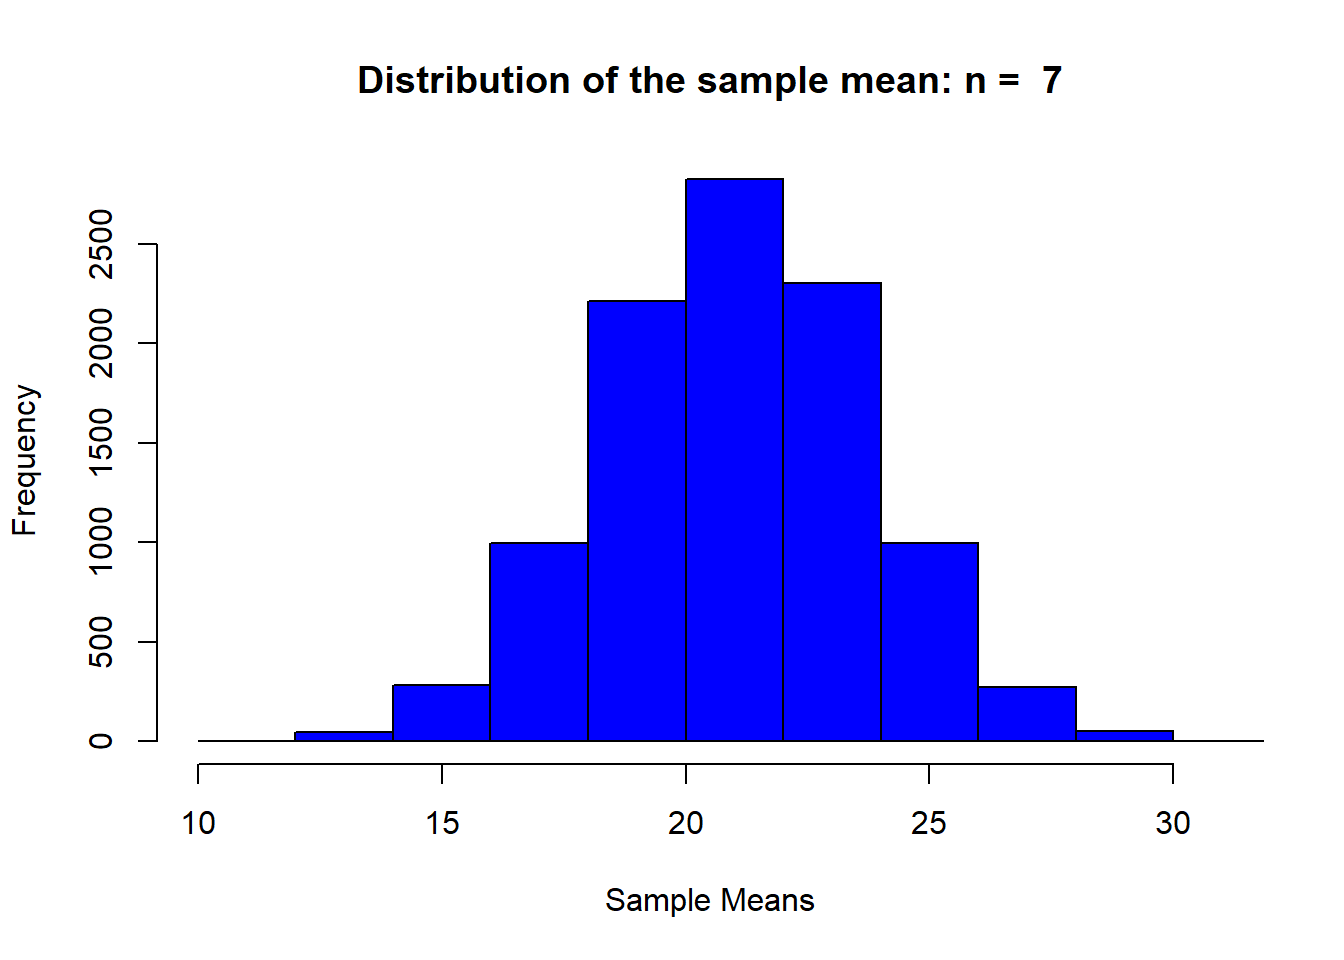
summary statistics of the distribution of the simulated sample means.
summary(xbar_holder)## Min. 1st Qu. Median Mean 3rd Qu. Max.
## 10.74 19.21 21.04 21.02 22.87 32.02The Pvalue!
The probability of observing a result as extreme or more extreme than what was observed assuming the null hypothesis is true.
pvalue = length(which(xbar_holder>29.86))/simulations
pvalue
## [1] 3e-04