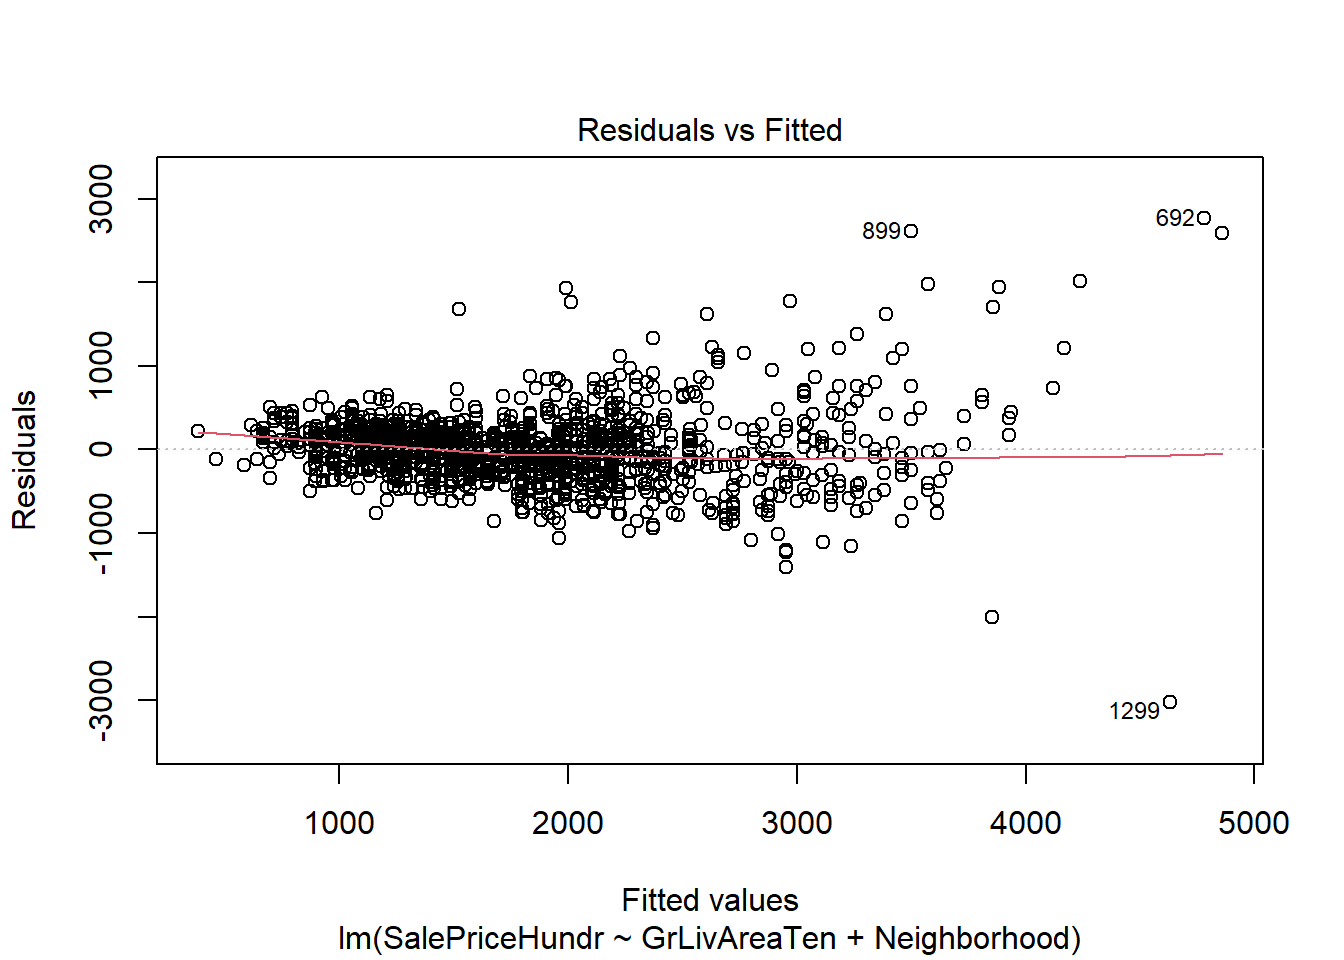
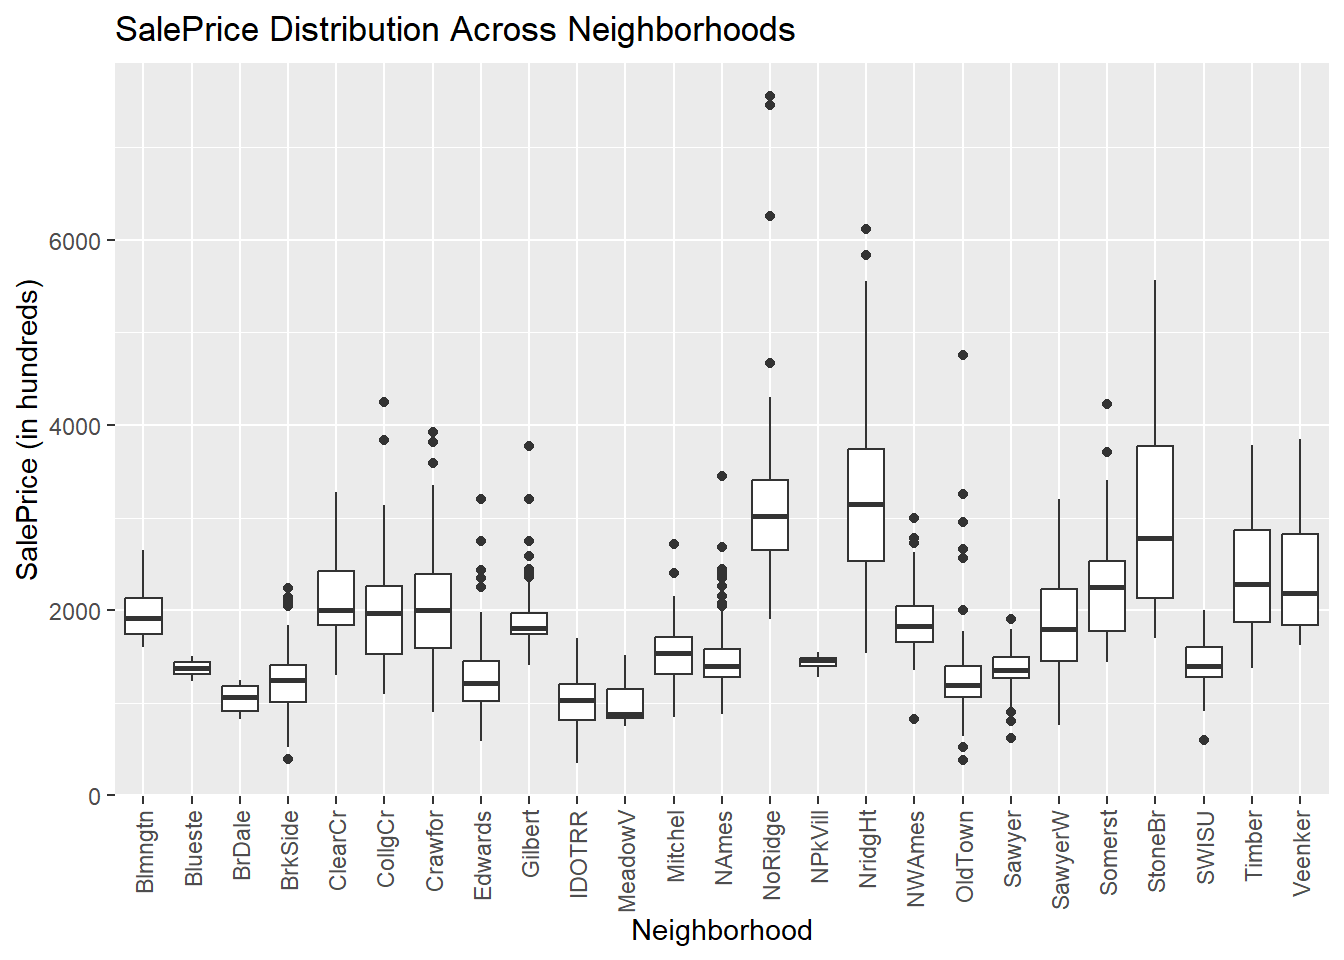
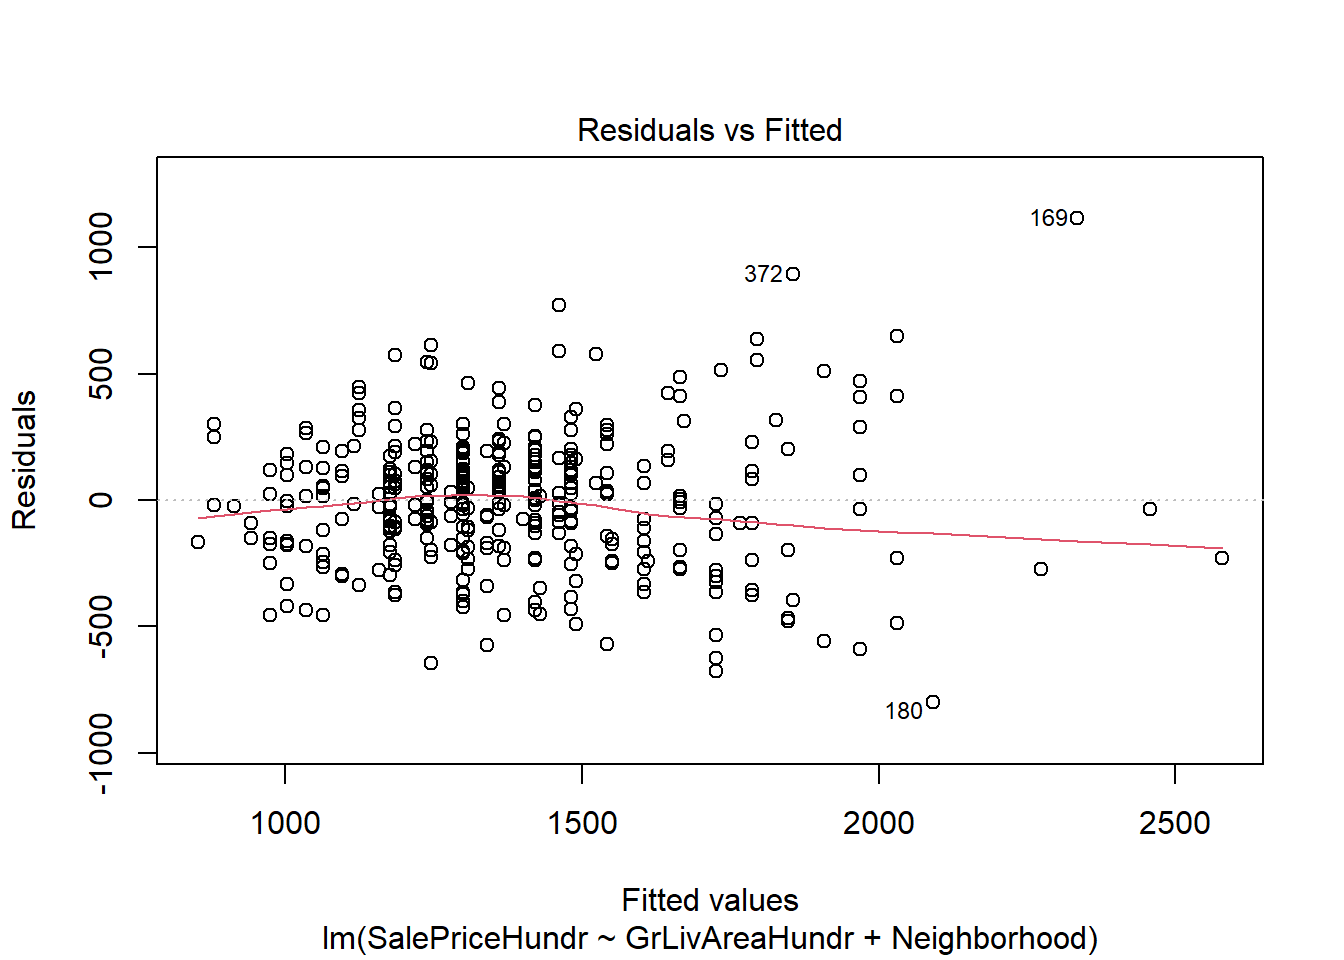
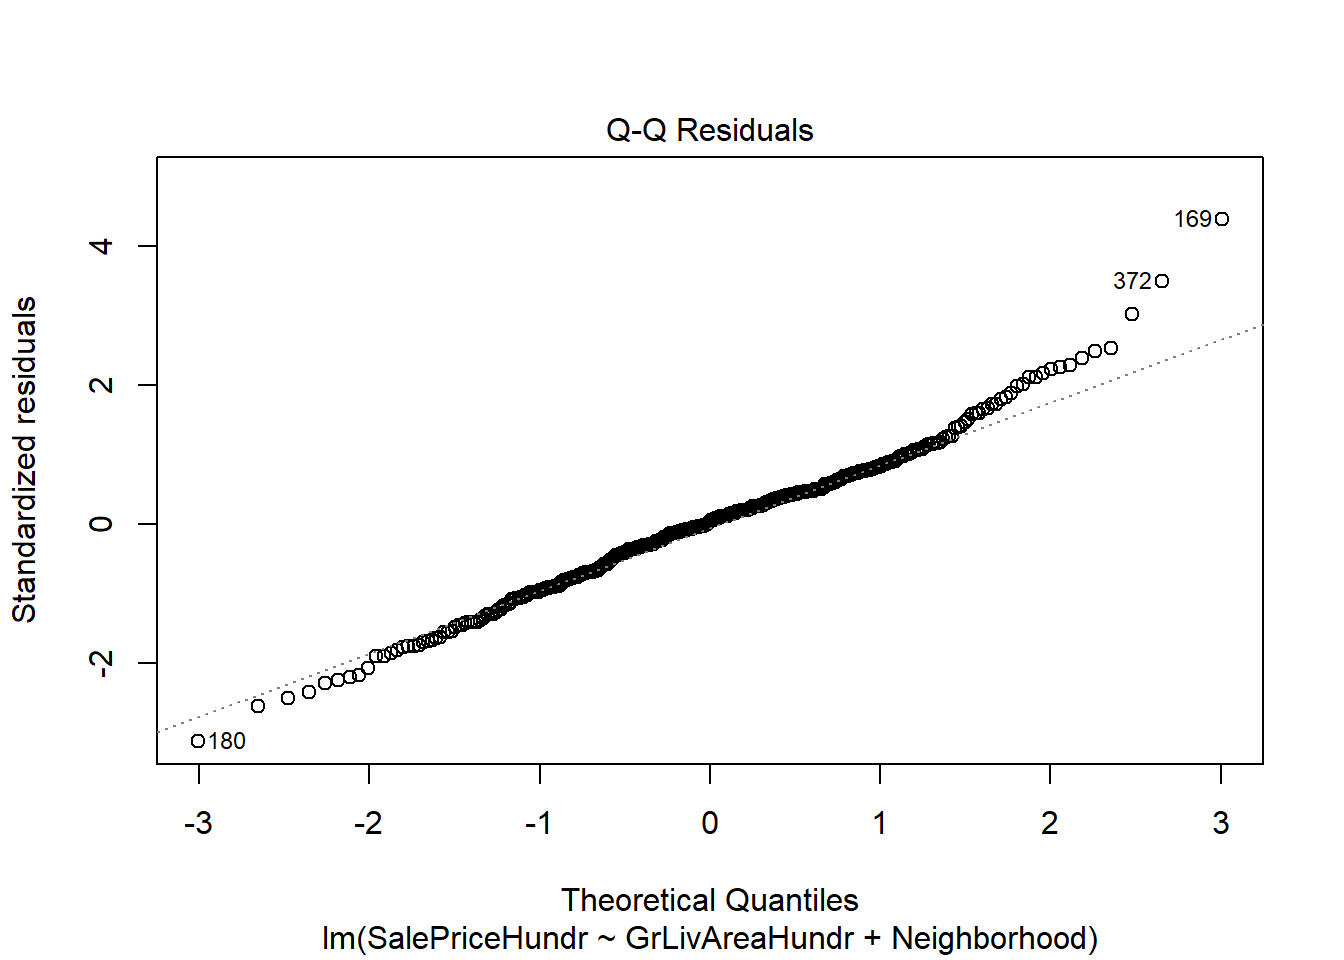
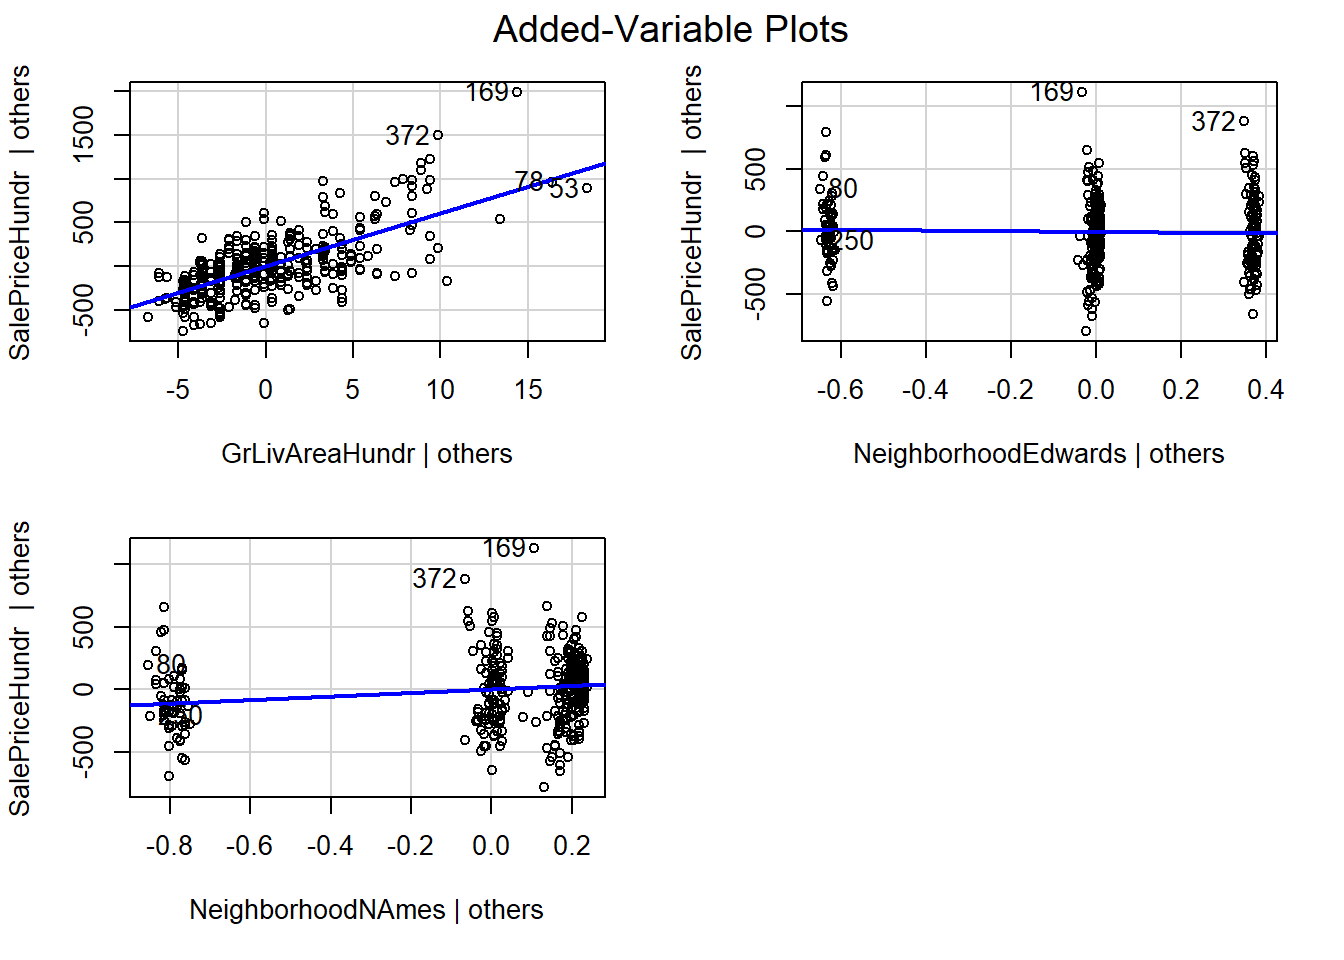
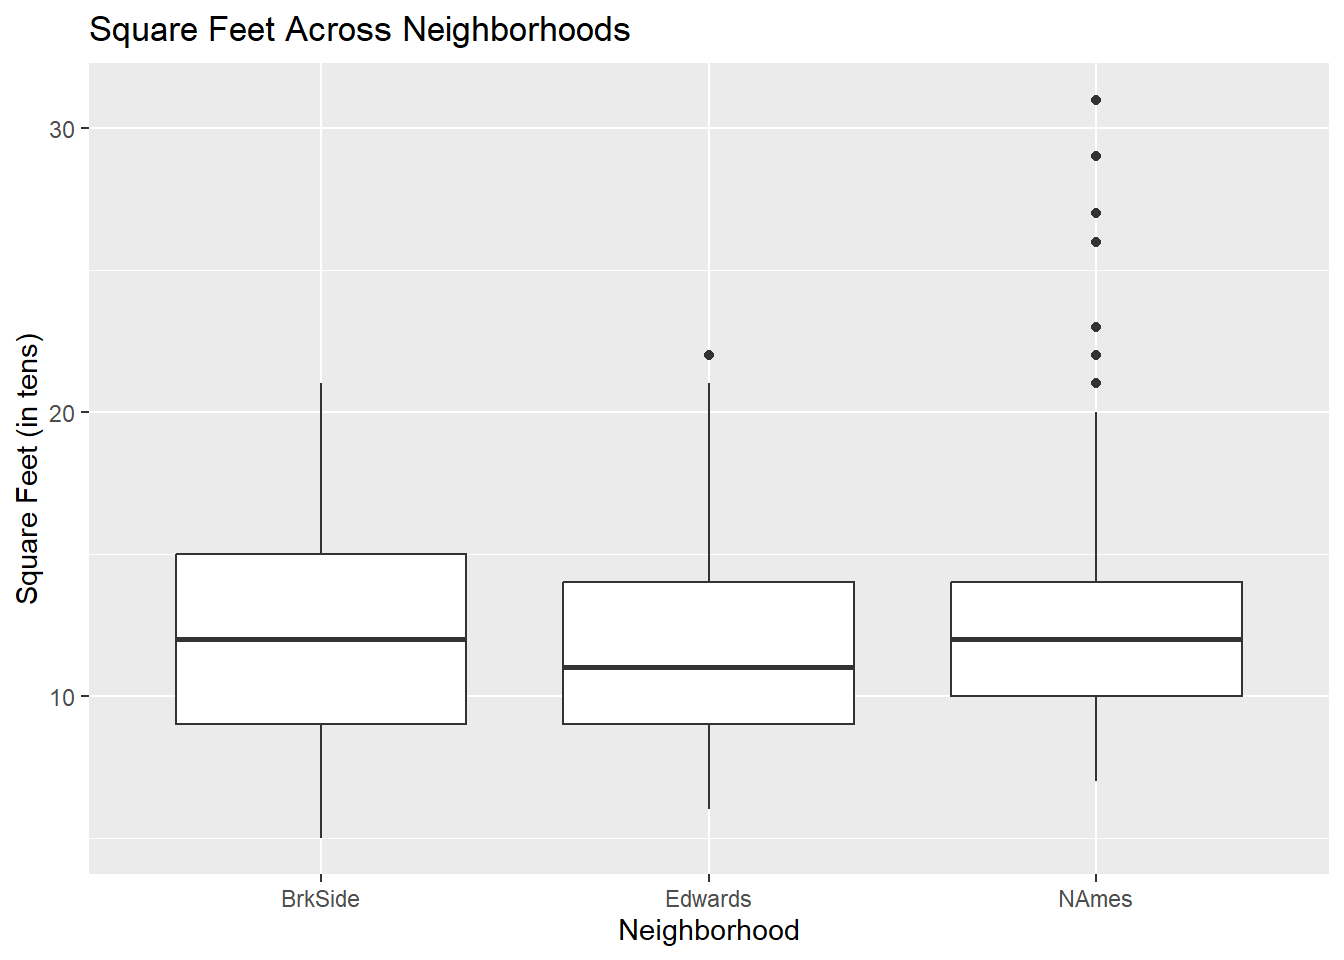
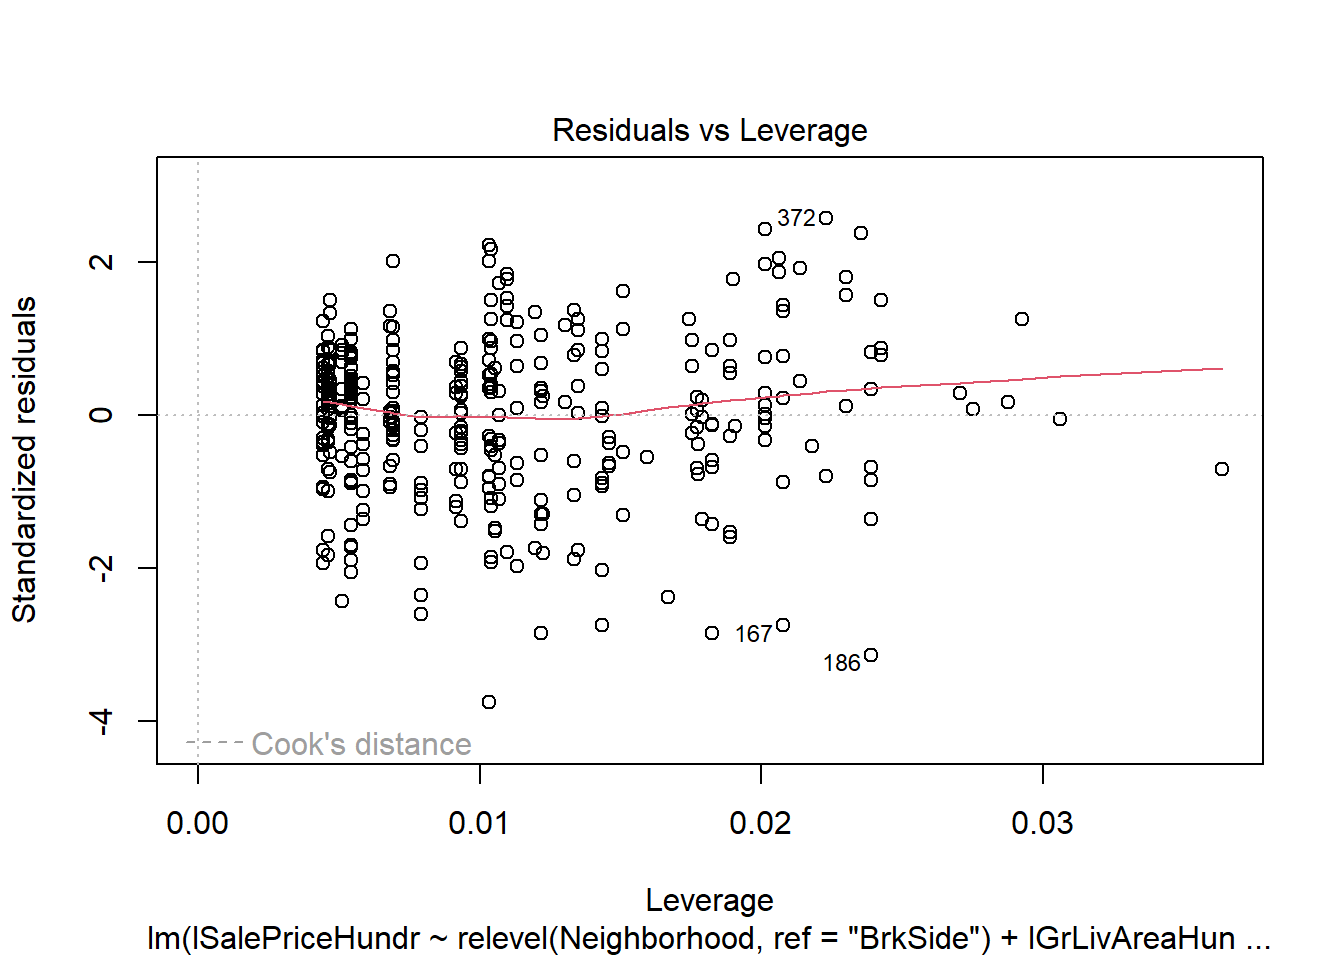
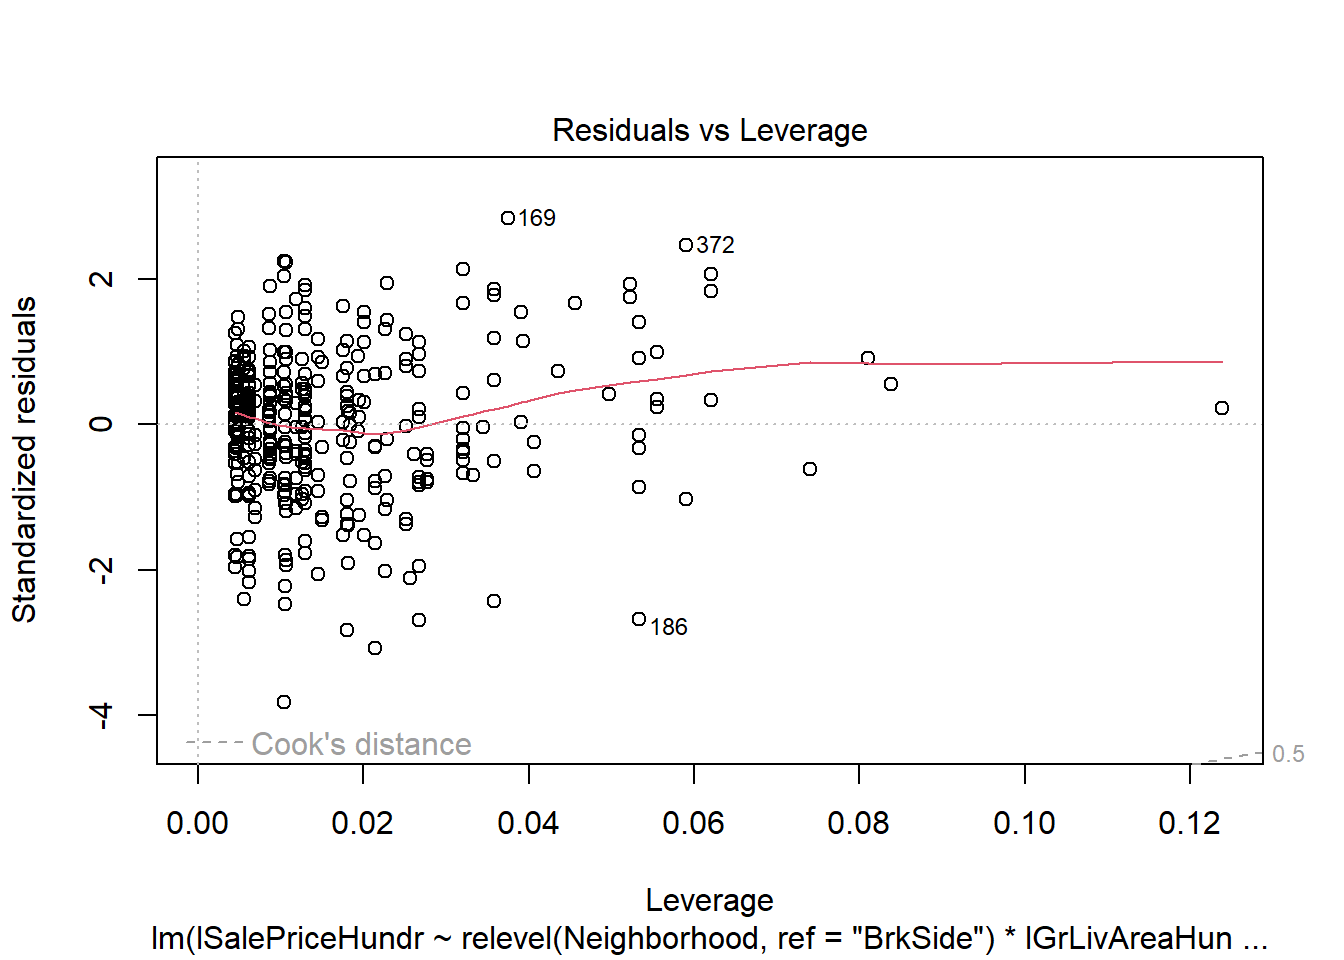
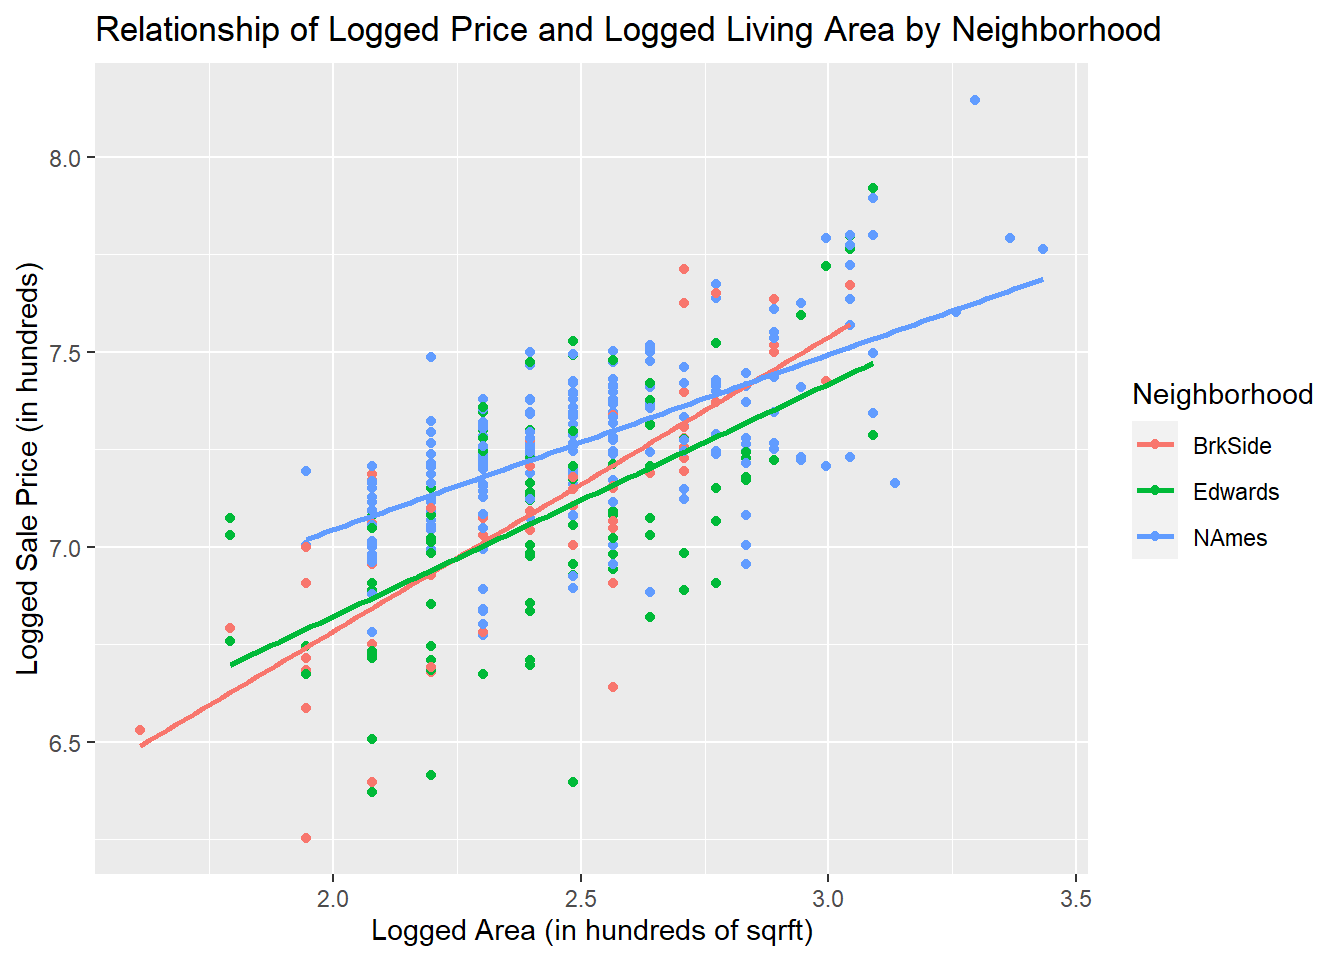
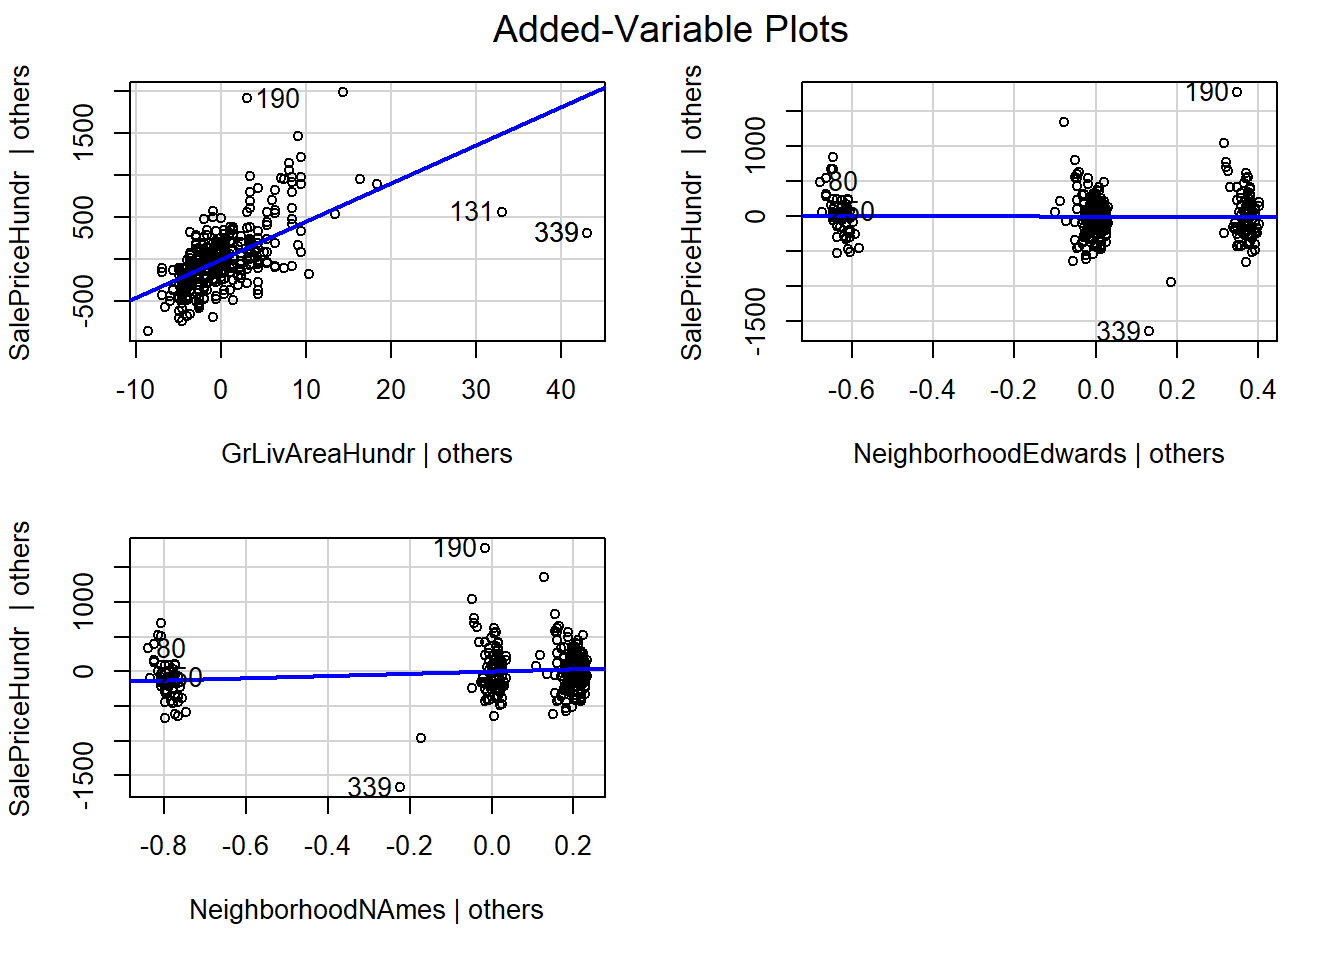
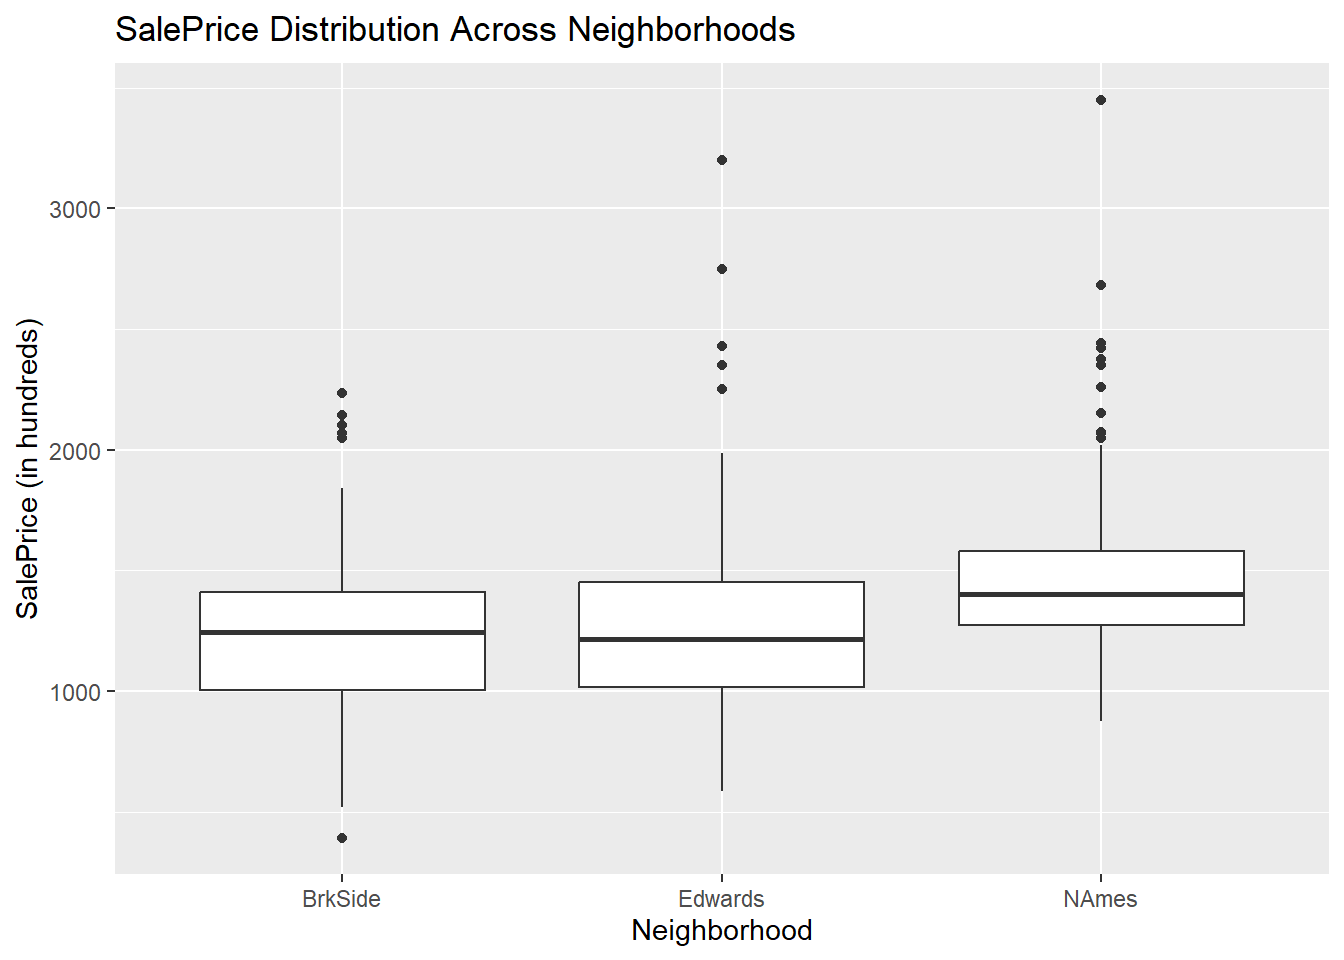
725(190) in Edwards, 643 (169) in NAmes prices are high for living
space and thus the sales-living regression is off
##        Id           MSSubClass      MSZoning          LotFrontage        LotArea         Street             Alley             LotShape         LandContour
##  Min.   :  10.0   Min.   : 20.0   Length:379         Min.   : 24.00   Min.   : 2522   Length:379         Length:379         Length:379         Length:379
##  1st Qu.: 375.0   1st Qu.: 20.0   Class :character   1st Qu.: 60.00   1st Qu.: 7634   Class :character   Class :character   Class :character   Class :character
##  Median : 737.0   Median : 30.0   Mode  :character   Median : 70.00   Median : 9084   Mode  :character   Mode  :character   Mode  :character   Mode  :character
##  Mean   : 743.7   Mean   : 45.2                      Mean   : 70.31   Mean   : 9520
##  3rd Qu.:1117.0   3rd Qu.: 60.0                      3rd Qu.: 79.00   3rd Qu.:10626
##  Max.   :1460.0   Max.   :190.0                      Max.   :313.00   Max.   :31770
##                                                      NA's   :54
##   Utilities          LotConfig          LandSlope          Neighborhood  Condition1         Condition2          BldgType          HouseStyle         OverallQual
##  Length:379         Length:379         Length:379         BrkSide: 57   Length:379         Length:379         Length:379         Length:379         Min.   :1.000
##  Class :character   Class :character   Class :character   Edwards: 97   Class :character   Class :character   Class :character   Class :character   1st Qu.:5.000
##  Mode  :character   Mode  :character   Mode  :character   NAmes  :225   Mode  :character   Mode  :character   Mode  :character   Mode  :character   Median :5.000
##                                                                                                                                                     Mean   :5.216
##                                                                                                                                                     3rd Qu.:6.000
##                                                                                                                                                     Max.   :8.000
##
##   OverallCond      YearBuilt     YearRemodAdd   RoofStyle           RoofMatl         Exterior1st        Exterior2nd         MasVnrType          MasVnrArea
##  Min.   :1.000   Min.   :1900   Min.   :1950   Length:379         Length:379         Length:379         Length:379         Length:379         Min.   :   0.00
##  1st Qu.:5.000   1st Qu.:1947   1st Qu.:1954   Class :character   Class :character   Class :character   Class :character   Class :character   1st Qu.:   0.00
##  Median :6.000   Median :1957   Median :1965   Mode  :character   Mode  :character   Mode  :character   Mode  :character   Mode  :character   Median :   0.00
##  Mean   :5.765   Mean   :1954   Mean   :1972                                                                                                  Mean   :  69.49
##  3rd Qu.:7.000   3rd Qu.:1964   3rd Qu.:1994                                                                                                  3rd Qu.: 104.50
##  Max.   :9.000   Max.   :2009   Max.   :2009                                                                                                  Max.   :1115.00
##
##   ExterQual          ExterCond          Foundation          BsmtQual           BsmtCond         BsmtExposure       BsmtFinType1         BsmtFinSF1     BsmtFinType2
##  Length:379         Length:379         Length:379         Length:379         Length:379         Length:379         Length:379         Min.   :   0.0   Length:379
##  Class :character   Class :character   Class :character   Class :character   Class :character   Class :character   Class :character   1st Qu.:   0.0   Class :character
##  Mode  :character   Mode  :character   Mode  :character   Mode  :character   Mode  :character   Mode  :character   Mode  :character   Median : 399.0   Mode  :character
##                                                                                                                                       Mean   : 406.1
##                                                                                                                                       3rd Qu.: 626.0
##                                                                                                                                       Max.   :1880.0
##
##    BsmtFinSF2        BsmtUnfSF       TotalBsmtSF       Heating           HeatingQC          CentralAir         Electrical          X1stFlrSF      X2ndFlrSF
##  Min.   :   0.00   Min.   :   0.0   Min.   :   0.0   Length:379         Length:379         Length:379         Length:379         Min.   : 495   Min.   :   0.0
##  1st Qu.:   0.00   1st Qu.: 165.5   1st Qu.: 780.0   Class :character   Class :character   Class :character   Class :character   1st Qu.: 895   1st Qu.:   0.0
##  Median :   0.00   Median : 410.0   Median : 945.0   Mode  :character   Mode  :character   Mode  :character   Mode  :character   Median :1053   Median :   0.0
##  Mean   :  64.74   Mean   : 464.0   Mean   : 934.9                                                                               Mean   :1099   Mean   : 181.5
##  3rd Qu.:   0.00   3rd Qu.: 707.0   3rd Qu.:1123.0                                                                               3rd Qu.:1232   3rd Qu.: 387.0
##  Max.   :1029.00   Max.   :1800.0   Max.   :2223.0                                                                               Max.   :2223   Max.   :1427.0
##
##   LowQualFinSF       GrLivArea     BsmtFullBath     BsmtHalfBath        FullBath        HalfBath       BedroomAbvGr    KitchenAbvGr   KitchenQual         TotRmsAbvGrd
##  Min.   :  0.000   Min.   : 520   Min.   :0.0000   Min.   :0.00000   Min.   :0.000   Min.   :0.0000   Min.   :1.000   Min.   :0.000   Length:379         Min.   : 3.000
##  1st Qu.:  0.000   1st Qu.:1003   1st Qu.:0.0000   1st Qu.:0.00000   1st Qu.:1.000   1st Qu.:0.0000   1st Qu.:2.000   1st Qu.:1.000   Class :character   1st Qu.: 5.000
##  Median :  0.000   Median :1200   Median :0.0000   Median :0.00000   Median :1.000   Median :0.0000   Median :3.000   Median :1.000   Mode  :character   Median : 6.000
##  Mean   :  3.008   Mean   :1283   Mean   :0.4274   Mean   :0.08179   Mean   :1.227   Mean   :0.2269   Mean   :2.873   Mean   :1.055                      Mean   : 6.008
##  3rd Qu.:  0.000   3rd Qu.:1482   3rd Qu.:1.0000   3rd Qu.:0.00000   3rd Qu.:1.000   3rd Qu.:0.0000   3rd Qu.:3.000   3rd Qu.:1.000                      3rd Qu.: 7.000
##  Max.   :392.000   Max.   :3112   Max.   :3.0000   Max.   :2.00000   Max.   :3.000   Max.   :2.0000   Max.   :6.000   Max.   :2.000                      Max.   :12.000
##
##   Functional          Fireplaces    FireplaceQu         GarageType         GarageYrBlt   GarageFinish         GarageCars      GarageArea     GarageQual
##  Length:379         Min.   :0.000   Length:379         Length:379         Min.   :1916   Length:379         Min.   :0.000   Min.   :  0.0   Length:379
##  Class :character   1st Qu.:0.000   Class :character   Class :character   1st Qu.:1953   Class :character   1st Qu.:1.000   1st Qu.:280.0   Class :character
##  Mode  :character   Median :0.000   Mode  :character   Mode  :character   Median :1960   Mode  :character   Median :1.000   Median :380.0   Mode  :character
##                     Mean   :0.467                                         Mean   :1963                      Mean   :1.369   Mean   :377.9
##                     3rd Qu.:1.000                                         3rd Qu.:1969                      3rd Qu.:2.000   3rd Qu.:505.0
##                     Max.   :3.000                                         Max.   :2009                      Max.   :4.000   Max.   :968.0
##                                                                           NA's   :37
##   GarageCond         PavedDrive          WoodDeckSF      OpenPorchSF     EnclosedPorch      X3SsnPorch       ScreenPorch        PoolArea          PoolQC
##  Length:379         Length:379         Min.   :  0.00   Min.   :  0.00   Min.   :  0.00   Min.   :  0.000   Min.   :  0.00   Min.   :  0.000   Length:379
##  Class :character   Class :character   1st Qu.:  0.00   1st Qu.:  0.00   1st Qu.:  0.00   1st Qu.:  0.000   1st Qu.:  0.00   1st Qu.:  0.000   Class :character
##  Mode  :character   Mode  :character   Median :  0.00   Median :  0.00   Median :  0.00   Median :  0.000   Median :  0.00   Median :  0.000   Mode  :character
##                                        Mean   : 59.45   Mean   : 28.34   Mean   : 24.56   Mean   :  3.084   Mean   : 20.14   Mean   :  3.298
##                                        3rd Qu.: 89.00   3rd Qu.: 38.00   3rd Qu.:  0.00   3rd Qu.:  0.000   3rd Qu.:  0.00   3rd Qu.:  0.000
##                                        Max.   :736.00   Max.   :319.00   Max.   :552.00   Max.   :407.000   Max.   :385.00   Max.   :738.000
##
##     Fence           MiscFeature           MiscVal             MoSold           YrSold       SaleType         SaleCondition        SalePrice      SalePriceHundr
##  Length:379         Length:379         Min.   :    0.00   Min.   : 1.000   Min.   :2006   Length:379         Length:379         Min.   : 52000   Min.   : 520
##  Class :character   Class :character   1st Qu.:    0.00   1st Qu.: 5.000   1st Qu.:2007   Class :character   Class :character   1st Qu.:116000   1st Qu.:1160
##  Mode  :character   Mode  :character   Median :    0.00   Median : 6.000   Median :2008   Mode  :character   Mode  :character   Median :135000   Median :1350
##                                        Mean   :   79.42   Mean   : 6.285   Mean   :2008                                         Mean   :137662   Mean   :1377
##                                        3rd Qu.:    0.00   3rd Qu.: 7.000   3rd Qu.:2009                                         3rd Qu.:154650   3rd Qu.:1546
##                                        Max.   :15500.00   Max.   :12.000   Max.   :2010                                         Max.   :345000   Max.   :3450
##
##  GrLivAreaHundr
##  Min.   : 5.00
##  1st Qu.:10.00
##  Median :12.00
##  Mean   :12.35
##  3rd Qu.:14.00
##  Max.   :31.00
##
##
## Call:
## lm(formula = SalePriceHundr ~ GrLivAreaHundr + Neighborhood,
##     data = AmesHousing_Data3)
##
## Residuals:
##     Min      1Q  Median      3Q     Max
## -801.01 -171.53    8.91  141.70 1115.38
##
## Coefficients:
##                     Estimate Std. Error t value Pr(>|t|)
## (Intercept)          548.537     52.295  10.489  < 2e-16 ***
## GrLivAreaHundr        60.902      3.359  18.130  < 2e-16 ***
## NeighborhoodEdwards  -32.957     43.307  -0.761 0.447126
## NeighborhoodNAmes    141.731     38.574   3.674 0.000273 ***
## ---
## Signif. codes:  0 '***' 0.001 '**' 0.01 '*' 0.05 '.' 0.1 ' ' 1
##
## Residual standard error: 259.4 on 375 degrees of freedom
## Multiple R-squared:  0.5059, Adjusted R-squared:  0.5019
## F-statistic:   128 on 3 and 375 DF,  p-value: < 2.2e-16
##                    GVIF Df GVIF^(1/(2*Df))
## GrLivAreaHundr 1.007121  1        1.003554
## Neighborhood   1.007121  2        1.001776
## integer(0)
## `stat_bin()` using `bins = 30`. Pick better value with `binwidth`.
## `stat_bin()` using `bins = 30`. Pick better value with `binwidth`.
## + Fold1: intercept=TRUE
## - Fold1: intercept=TRUE
## + Fold2: intercept=TRUE
## - Fold2: intercept=TRUE
## + Fold3: intercept=TRUE
## - Fold3: intercept=TRUE
## + Fold4: intercept=TRUE
## - Fold4: intercept=TRUE
## + Fold5: intercept=TRUE
## - Fold5: intercept=TRUE
## Aggregating results
## Fitting final model on full training set
## Linear Regression
##
## 383 samples
##   2 predictor
##
## No pre-processing
## Resampling: Cross-Validated (5 fold)
## Summary of sample sizes: 306, 306, 306, 307, 307
## Resampling results:
##
##   RMSE     Rsquared   MAE
##   301.959  0.4330415  208.6483
##
## Tuning parameter 'intercept' was held constant at a value of TRUE
##
## Call:
## lm(formula = lSalePriceHundr ~ lGrLivAreaHundr + Neighborhood,
##     data = AmesHousing_Data3)
##
## Residuals:
##      Min       1Q   Median       3Q      Max
## -0.71147 -0.11204  0.02033  0.11974  0.48404
##
## Coefficients:
##                     Estimate Std. Error t value Pr(>|t|)
## (Intercept)          5.79475    0.08233  70.386  < 2e-16 ***
## lGrLivAreaHundr      0.53874    0.03251  16.574  < 2e-16 ***
## NeighborhoodEdwards -0.02507    0.03175  -0.790     0.43
## NeighborhoodNAmes    0.12769    0.02830   4.512 8.61e-06 ***
## ---
## Signif. codes:  0 '***' 0.001 '**' 0.01 '*' 0.05 '.' 0.1 ' ' 1
##
## Residual standard error: 0.1901 on 375 degrees of freedom
## Multiple R-squared:  0.482,  Adjusted R-squared:  0.4779
## F-statistic: 116.3 on 3 and 375 DF,  p-value: < 2.2e-16
## # A tibble: 4 × 5
##   term                estimate std.error statistic   p.value
##   <chr>                  <dbl>     <dbl>     <dbl>     <dbl>
## 1 (Intercept)           5.79      0.0823    70.4   3.26e-218
## 2 lGrLivAreaHundr       0.539     0.0325    16.6   1.12e- 46
## 3 NeighborhoodEdwards  -0.0251    0.0318    -0.790 4.30e-  1
## 4 NeighborhoodNAmes     0.128     0.0283     4.51  8.61e-  6
## + Fold1: intercept=TRUE
## - Fold1: intercept=TRUE
## + Fold2: intercept=TRUE
## - Fold2: intercept=TRUE
## + Fold3: intercept=TRUE
## - Fold3: intercept=TRUE
## + Fold4: intercept=TRUE
## - Fold4: intercept=TRUE
## + Fold5: intercept=TRUE
## - Fold5: intercept=TRUE
## Aggregating results
## Fitting final model on full training set
## Linear Regression
##
## 379 samples
##   2 predictor
##
## No pre-processing
## Resampling: Cross-Validated (5 fold)
## Summary of sample sizes: 302, 305, 302, 303, 304
## Resampling results:
##
##   RMSE       Rsquared   MAE
##   0.1898086  0.4803786  0.1458332
##
## Tuning parameter 'intercept' was held constant at a value of TRUE
##
## -------------------------------Neighborhood no interaction----------------------
##
## Call:
## lm(formula = lSalePriceHundr ~ relevel(Neighborhood, ref = "BrkSide") +
##     lGrLivAreaHundr, data = AmesHousing_Data3)
##
## Residuals:
##      Min       1Q   Median       3Q      Max
## -0.71147 -0.11204  0.02033  0.11974  0.48404
##
## Coefficients:
##                                               Estimate Std. Error t value Pr(>|t|)
## (Intercept)                                    5.79475    0.08233  70.386  < 2e-16 ***
## relevel(Neighborhood, ref = "BrkSide")Edwards -0.02507    0.03175  -0.790     0.43
## relevel(Neighborhood, ref = "BrkSide")NAmes    0.12769    0.02830   4.512 8.61e-06 ***
## lGrLivAreaHundr                                0.53874    0.03251  16.574  < 2e-16 ***
## ---
## Signif. codes:  0 '***' 0.001 '**' 0.01 '*' 0.05 '.' 0.1 ' ' 1
##
## Residual standard error: 0.1901 on 375 degrees of freedom
## Multiple R-squared:  0.482,  Adjusted R-squared:  0.4779
## F-statistic: 116.3 on 3 and 375 DF,  p-value: < 2.2e-16
##                                                     2.5 %     97.5 %
## (Intercept)                                    5.63286455 5.95663116
## relevel(Neighborhood, ref = "BrkSide")Edwards -0.08751374 0.03736657
## relevel(Neighborhood, ref = "BrkSide")NAmes    0.07204322 0.18334072
## lGrLivAreaHundr                                0.47482796 0.60265980
## # A tibble: 4 × 5
##   term                                              estimate std.error statistic   p.value
##   <chr>                                                <dbl>     <dbl>     <dbl>     <dbl>
## 1 "(Intercept)"                                       5.79      0.0823    70.4   3.26e-218
## 2 "relevel(Neighborhood, ref = \"BrkSide\")Edwards"  -0.0251    0.0318    -0.790 4.30e-  1
## 3 "relevel(Neighborhood, ref = \"BrkSide\")NAmes"     0.128     0.0283     4.51  8.61e-  6
## 4 "lGrLivAreaHundr"                                   0.539     0.0325    16.6   1.12e- 46
##
## --------------------------Neighborhood interaction---------------------
##
## Call:
## lm(formula = lSalePriceHundr ~ relevel(Neighborhood, ref = "BrkSide") *
##     lGrLivAreaHundr, data = AmesHousing_Data3)
##
## Residuals:
##      Min       1Q   Median       3Q      Max
## -0.71340 -0.10485  0.02111  0.11456  0.52080
##
## Coefficients:
##                                                               Estimate Std. Error t value Pr(>|t|)
## (Intercept)                                                    5.27676    0.18529  28.478  < 2e-16 ***
## relevel(Neighborhood, ref = "BrkSide")Edwards                  0.35344    0.24449   1.446 0.149117
## relevel(Neighborhood, ref = "BrkSide")NAmes                    0.86966    0.21328   4.078 5.56e-05 ***
## lGrLivAreaHundr                                                0.75355    0.07615   9.896  < 2e-16 ***
## relevel(Neighborhood, ref = "BrkSide")Edwards:lGrLivAreaHundr -0.15791    0.09987  -1.581 0.114687
## relevel(Neighborhood, ref = "BrkSide")NAmes:lGrLivAreaHundr   -0.30483    0.08704  -3.502 0.000517 ***
## ---
## Signif. codes:  0 '***' 0.001 '**' 0.01 '*' 0.05 '.' 0.1 ' ' 1
##
## Residual standard error: 0.1873 on 373 degrees of freedom
## Multiple R-squared:  0.4998, Adjusted R-squared:  0.4931
## F-statistic: 74.55 on 5 and 373 DF,  p-value: < 2.2e-16
##                                                                    2.5 %      97.5 %
## (Intercept)                                                    4.9124087  5.64111168
## relevel(Neighborhood, ref = "BrkSide")Edwards                 -0.1273038  0.83418190
## relevel(Neighborhood, ref = "BrkSide")NAmes                    0.4502841  1.28902988
## lGrLivAreaHundr                                                0.6038177  0.90329087
## relevel(Neighborhood, ref = "BrkSide")Edwards:lGrLivAreaHundr -0.3542762  0.03846616
## relevel(Neighborhood, ref = "BrkSide")NAmes:lGrLivAreaHundr   -0.4759741 -0.13369004
## # A tibble: 6 × 5
##   term                                                              estimate std.error statistic  p.value
##   <chr>                                                                <dbl>     <dbl>     <dbl>    <dbl>
## 1 "(Intercept)"                                                        5.28     0.185      28.5  1.39e-95
## 2 "relevel(Neighborhood, ref = \"BrkSide\")Edwards"                    0.353    0.244       1.45 1.49e- 1
## 3 "relevel(Neighborhood, ref = \"BrkSide\")NAmes"                      0.870    0.213       4.08 5.56e- 5
## 4 "lGrLivAreaHundr"                                                    0.754    0.0761      9.90 1.18e-20
## 5 "relevel(Neighborhood, ref = \"BrkSide\")Edwards:lGrLivAreaHundr"   -0.158    0.0999     -1.58 1.15e- 1
## 6 "relevel(Neighborhood, ref = \"BrkSide\")NAmes:lGrLivAreaHundr"     -0.305    0.0870     -3.50 5.17e- 4
## `stat_bin()` using `bins = 30`. Pick better value with `binwidth`.
## `stat_bin()` using `bins = 30`. Pick better value with `binwidth`.
## `stat_bin()` using `bins = 30`. Pick better value with `binwidth`.
## `stat_bin()` using `bins = 30`. Pick better value with `binwidth`.
## `stat_bin()` using `bins = 30`. Pick better value with `binwidth`.
## `stat_bin()` using `bins = 30`. Pick better value with `binwidth`.
## [1] "Intercept (in hundreds of dollars): 328.57"
## [1] "Effect of Edwards (in hundreds of dollars): 0.98"
## [1] "Effect of NAmes (in hundreds of dollars): 1.14"
## [1] "Effect of GrLivArea (in hundreds of square feet): 1.71"
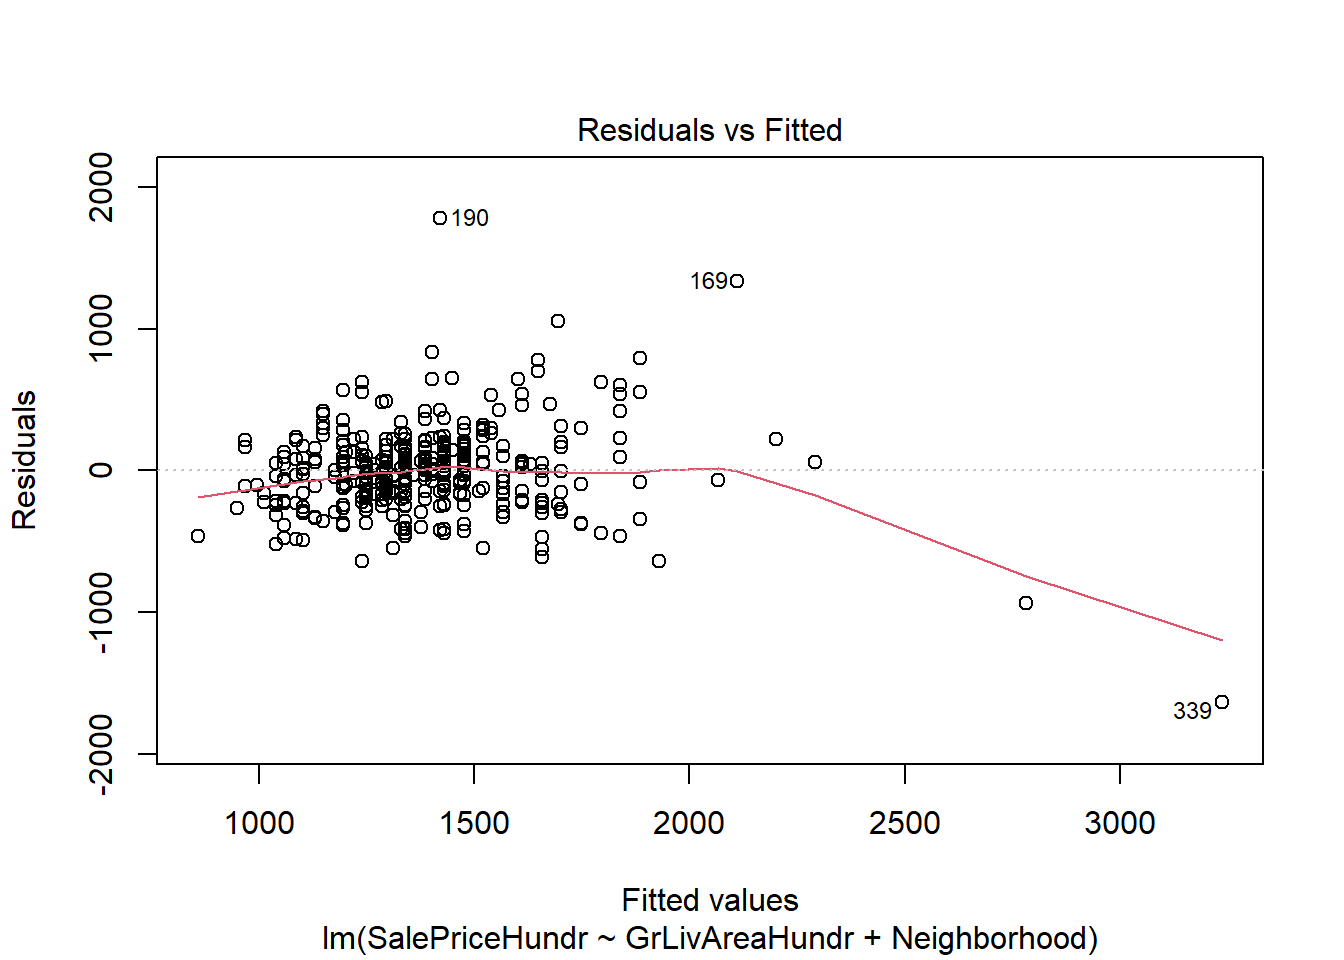
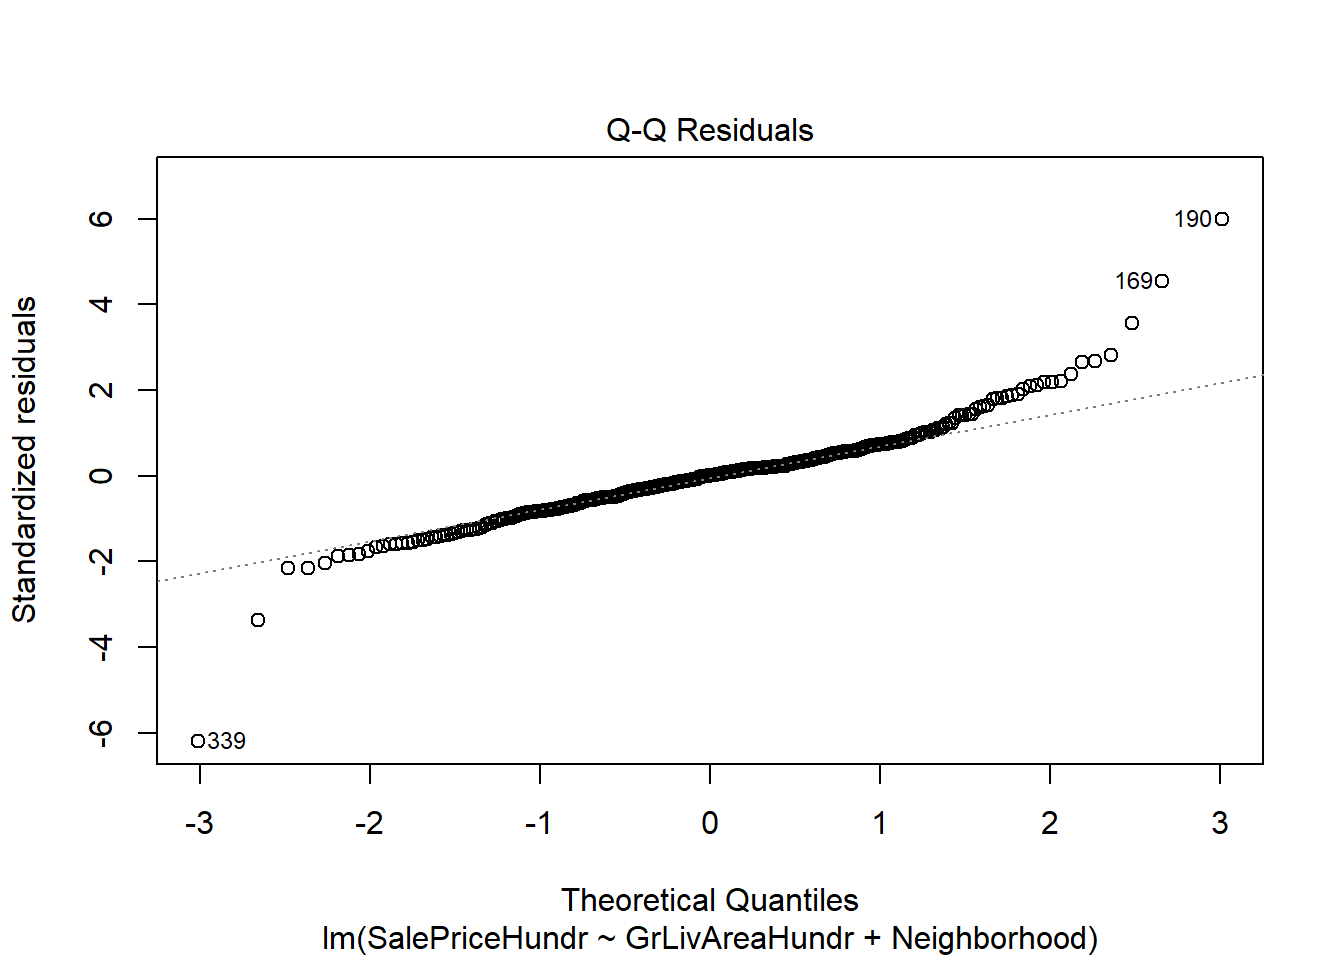
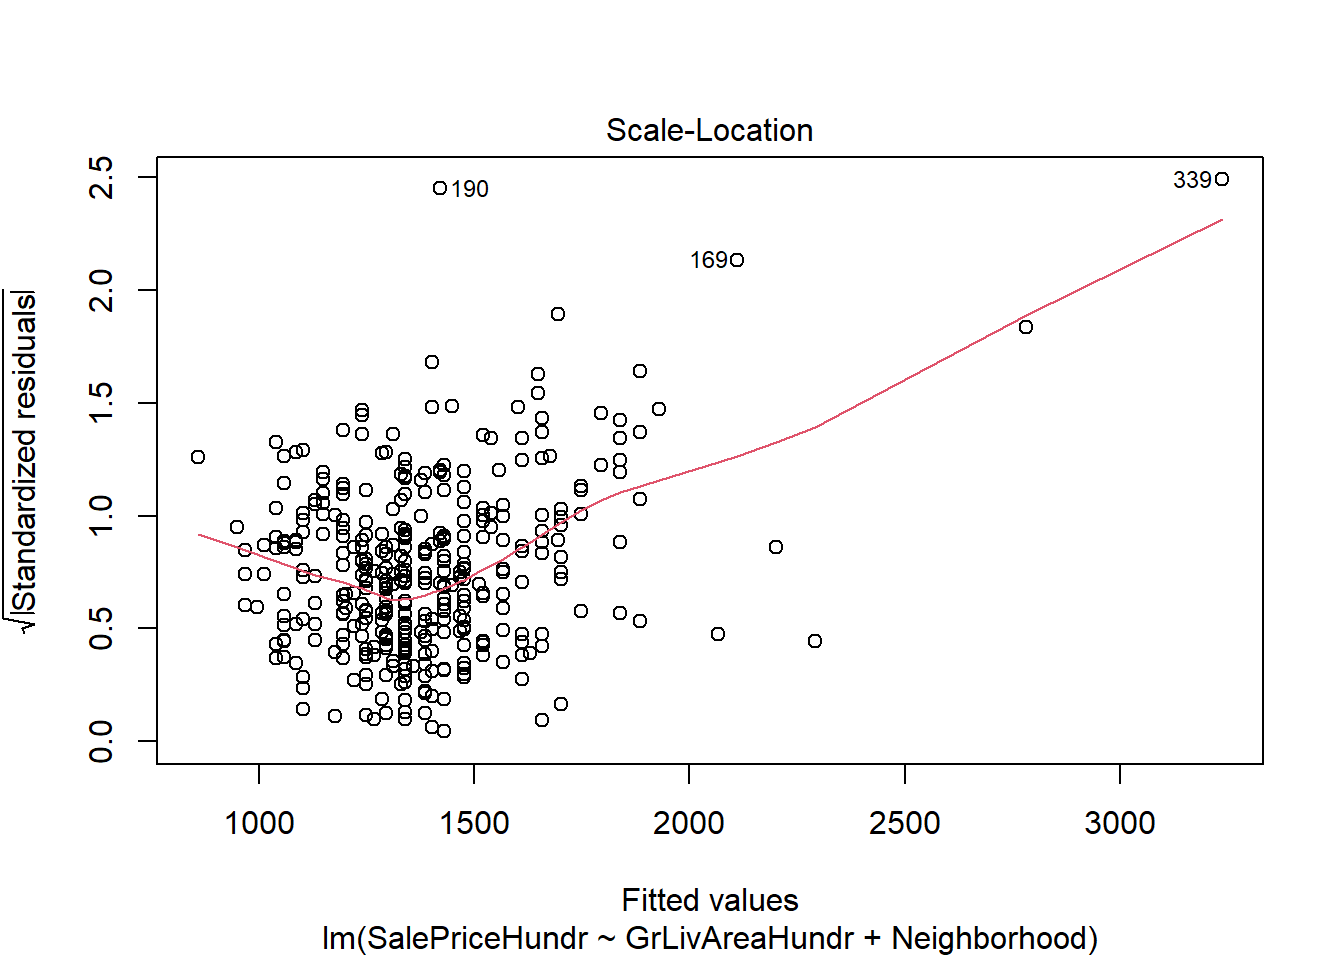
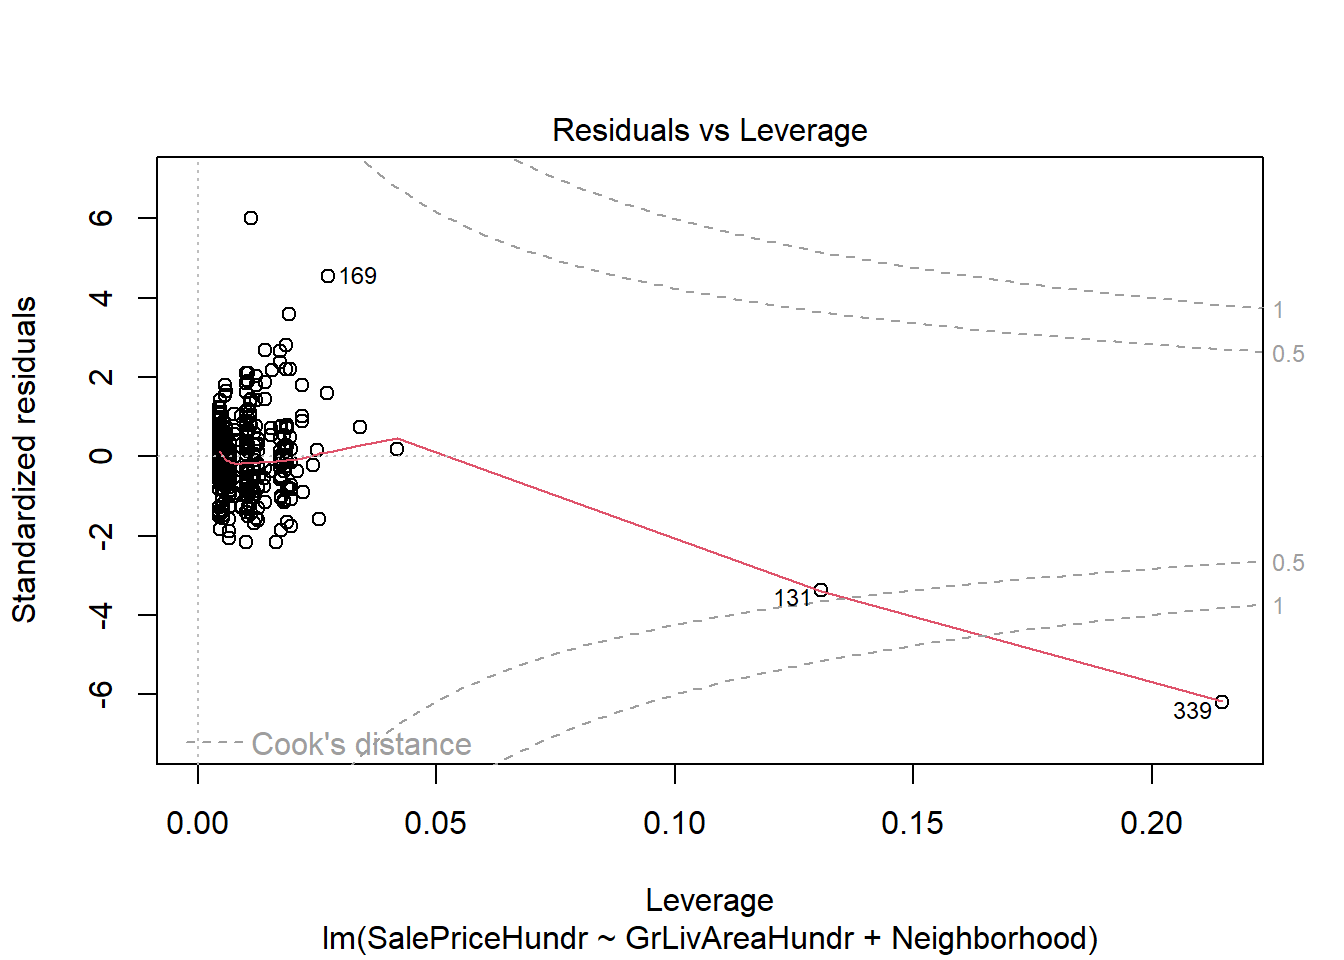
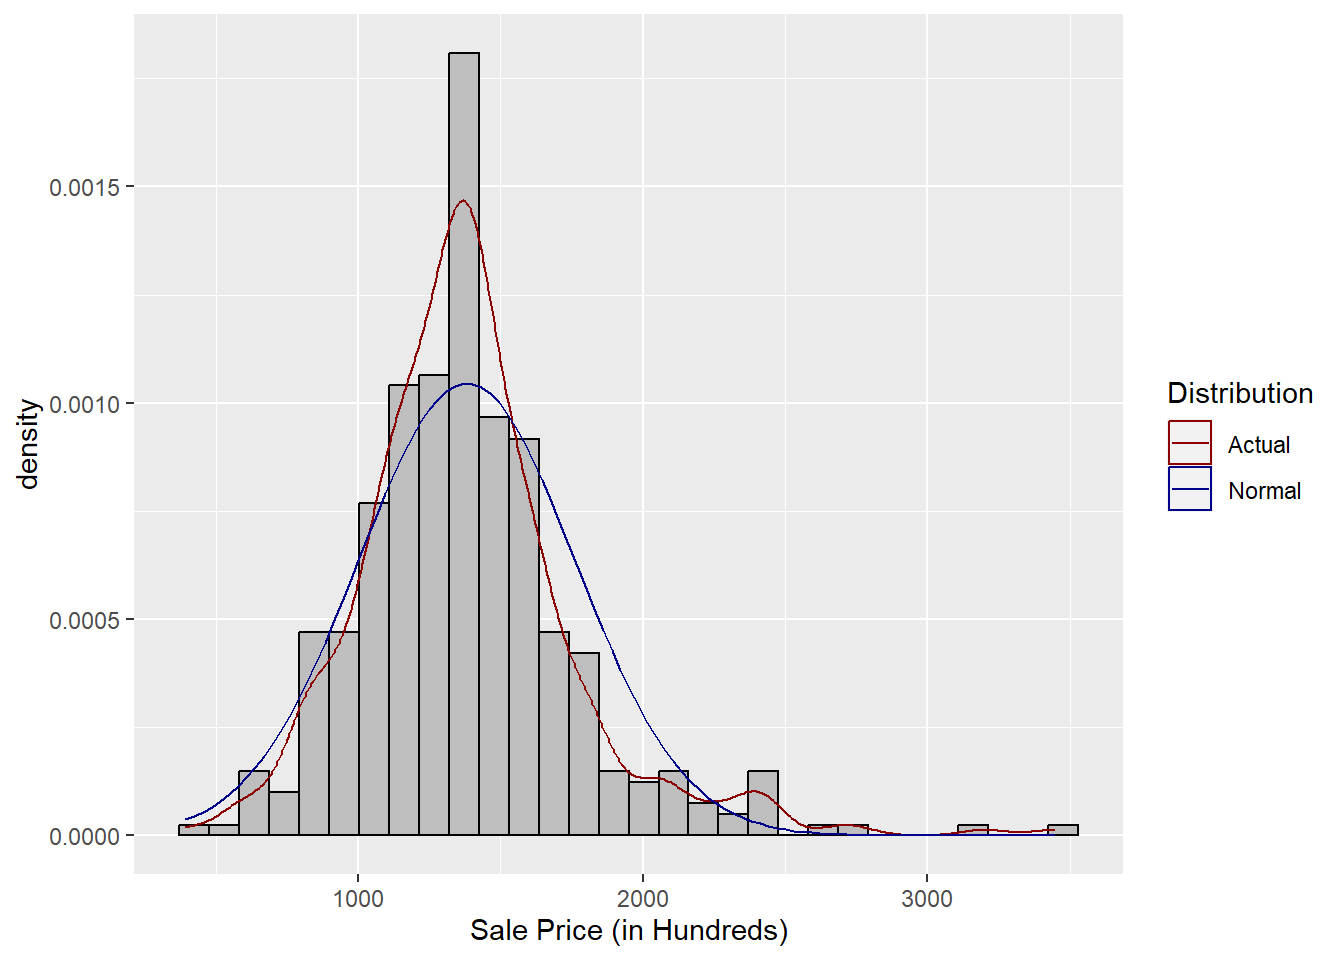
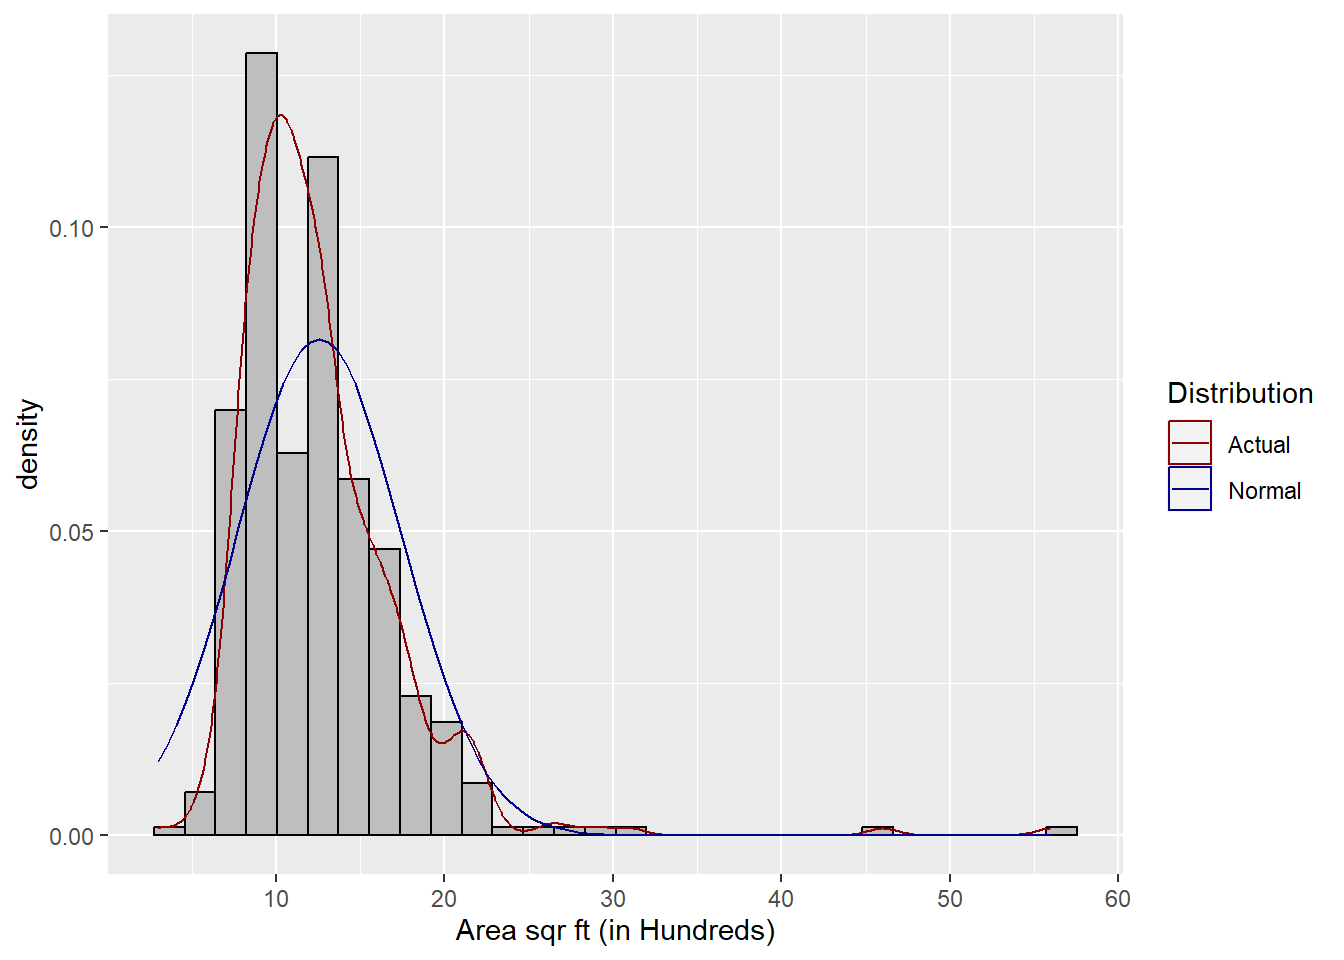
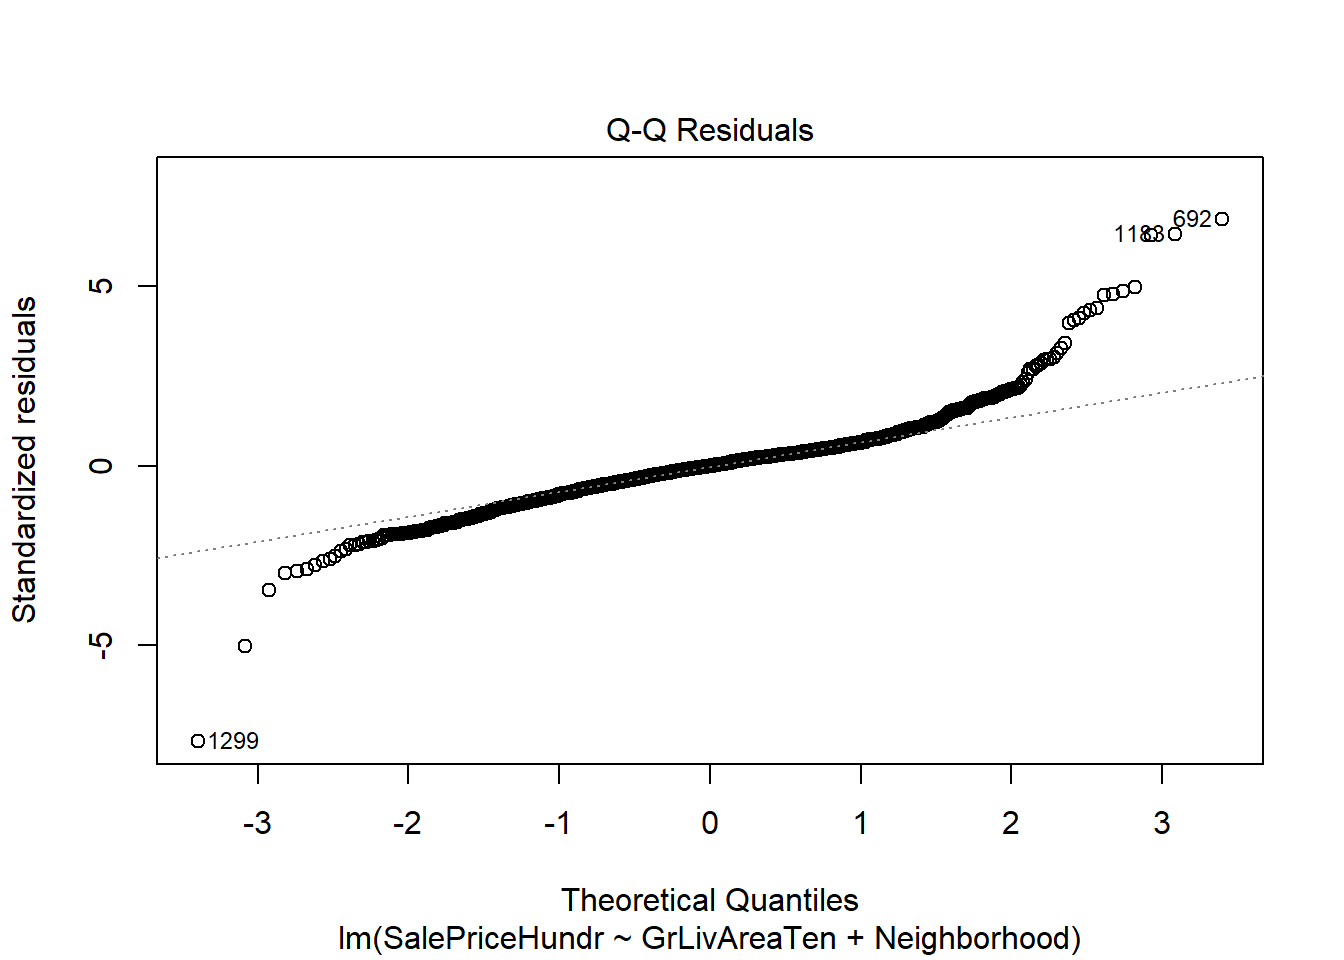
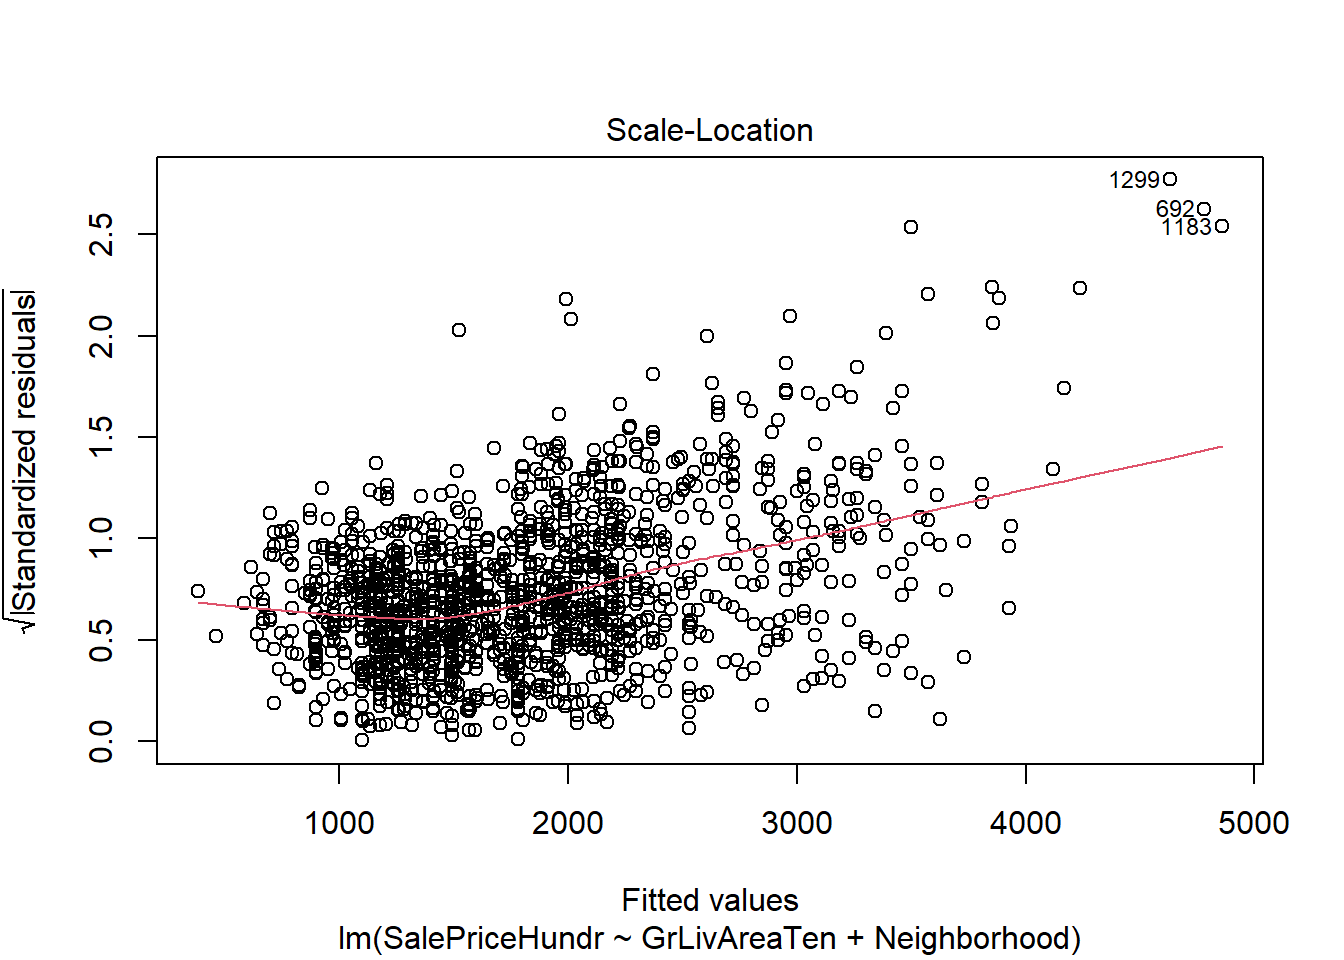
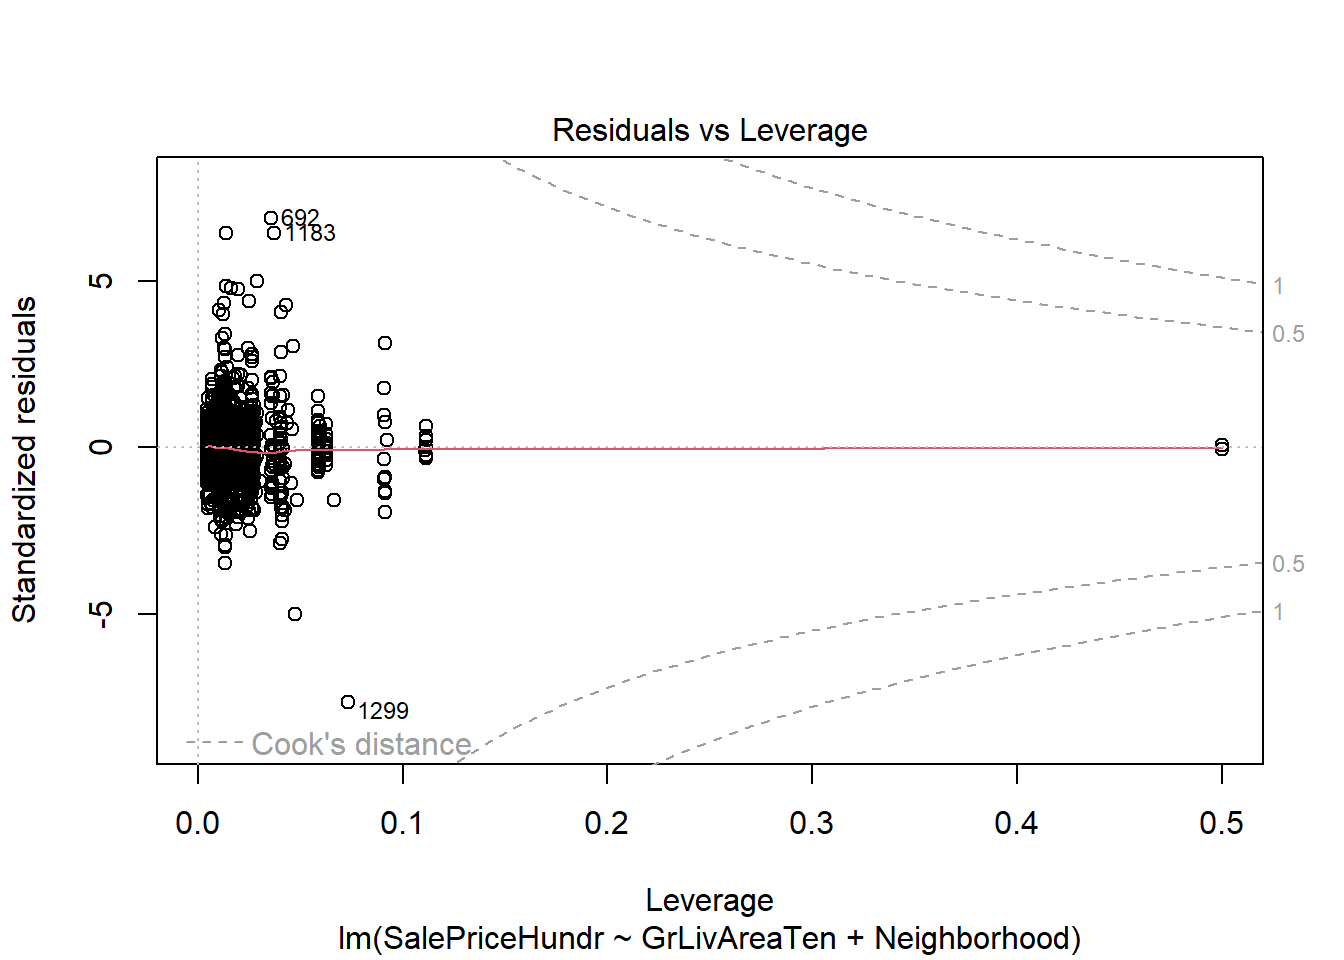
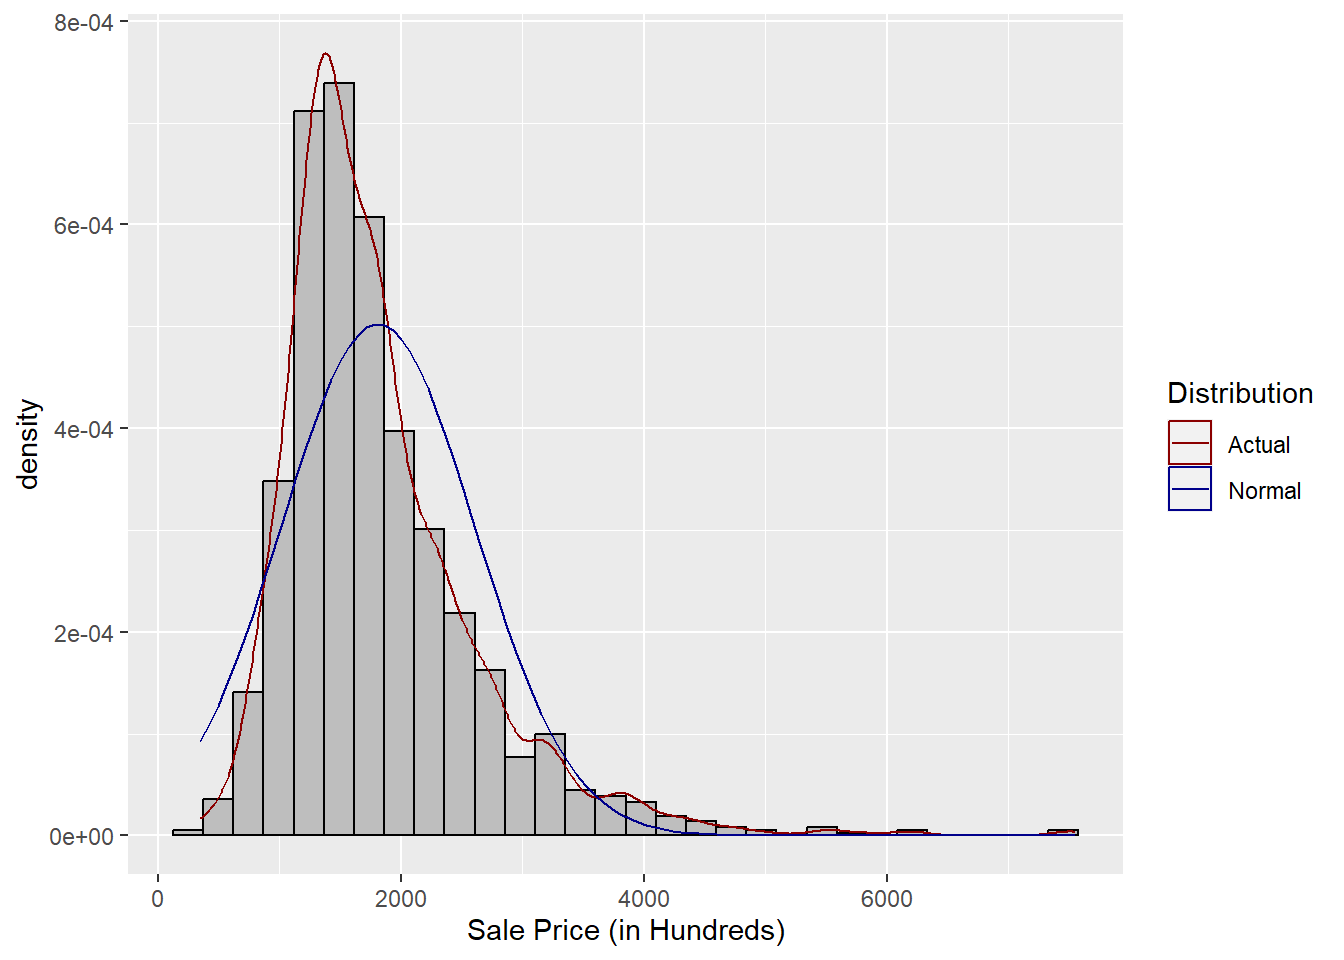
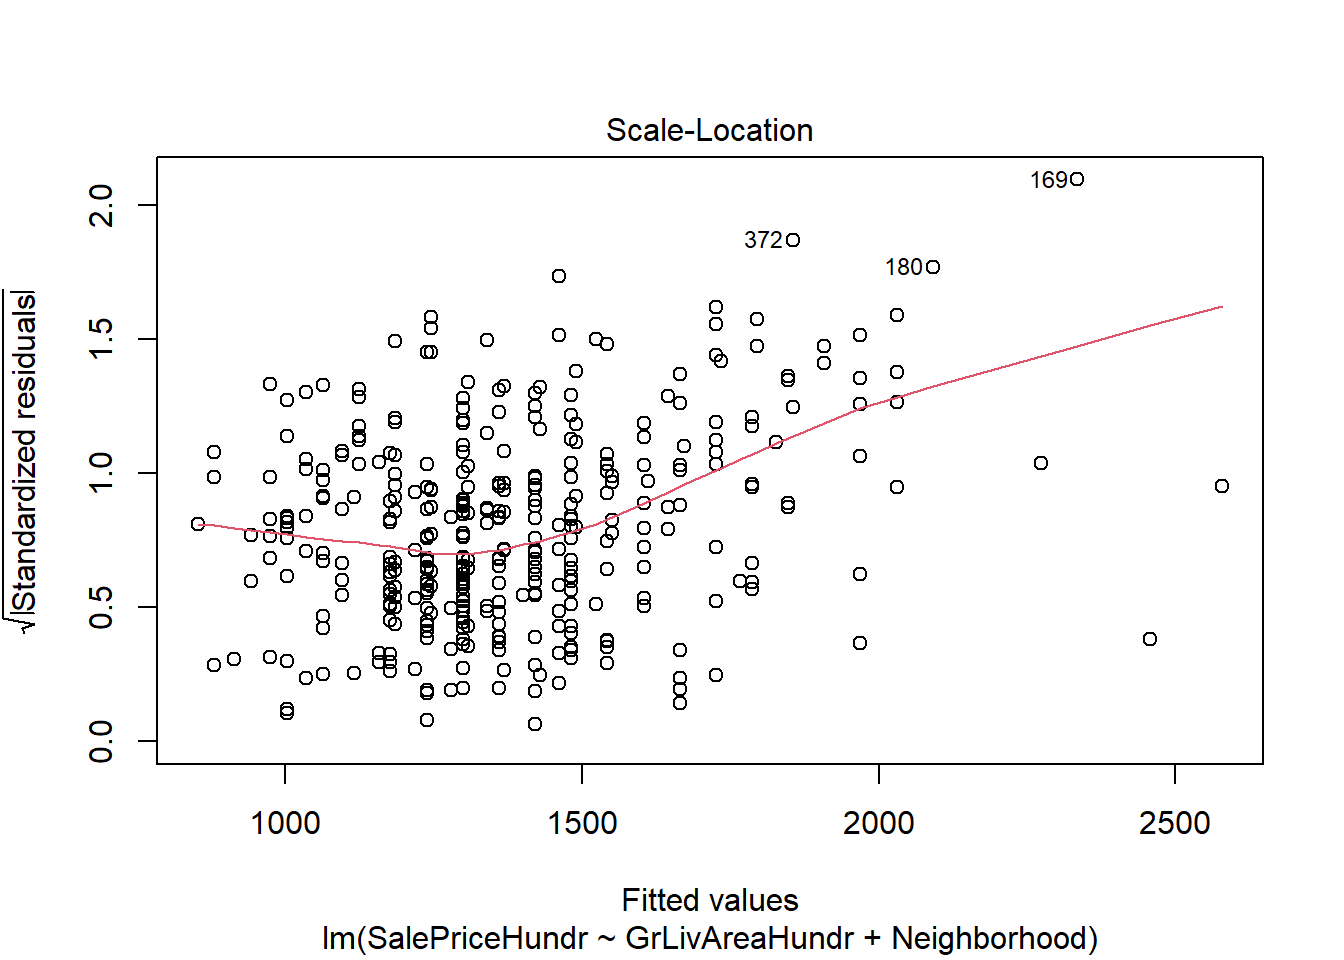
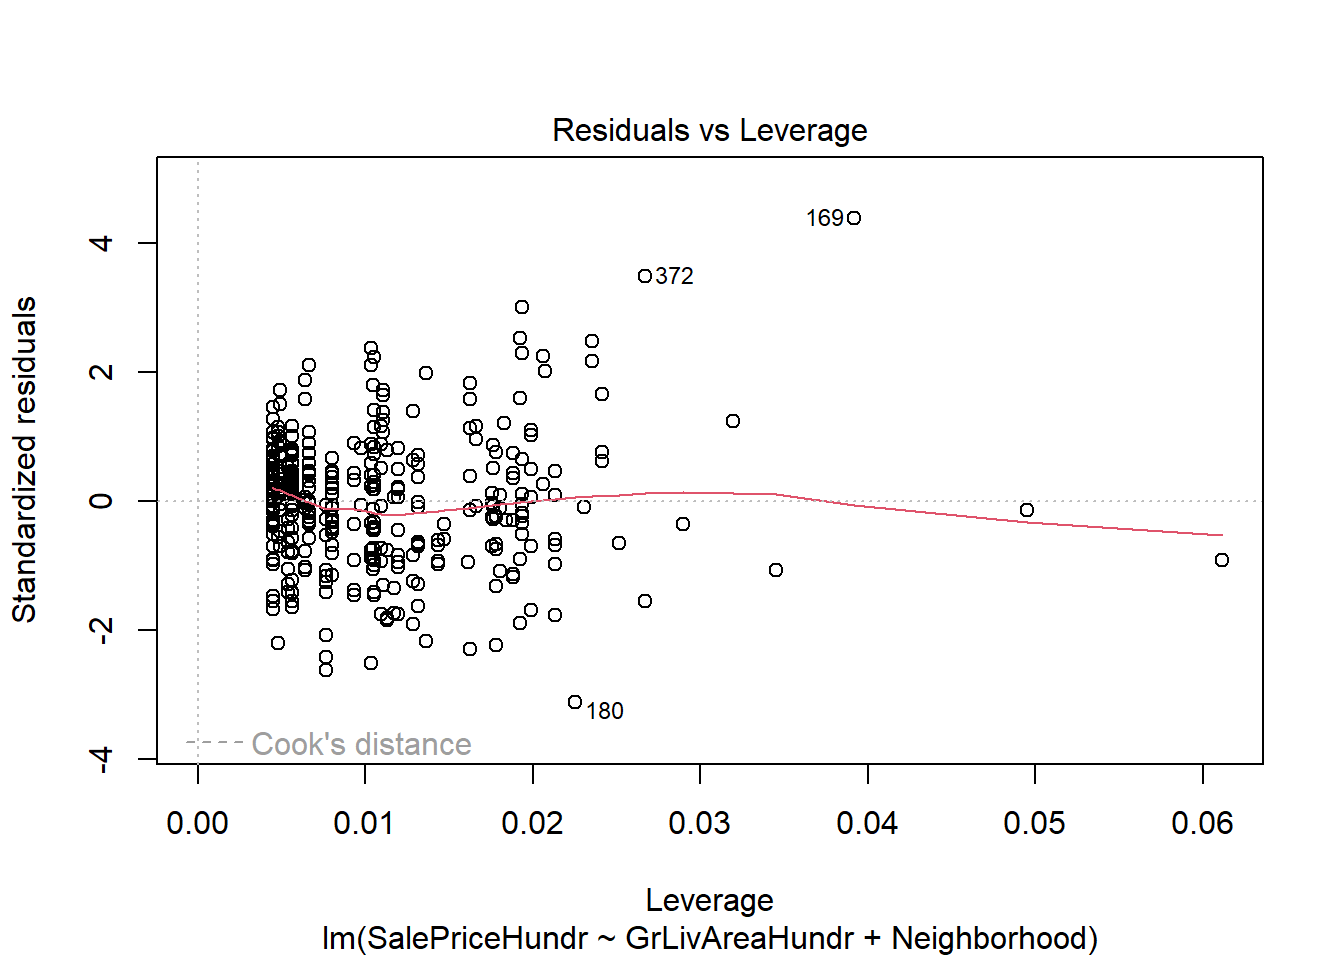
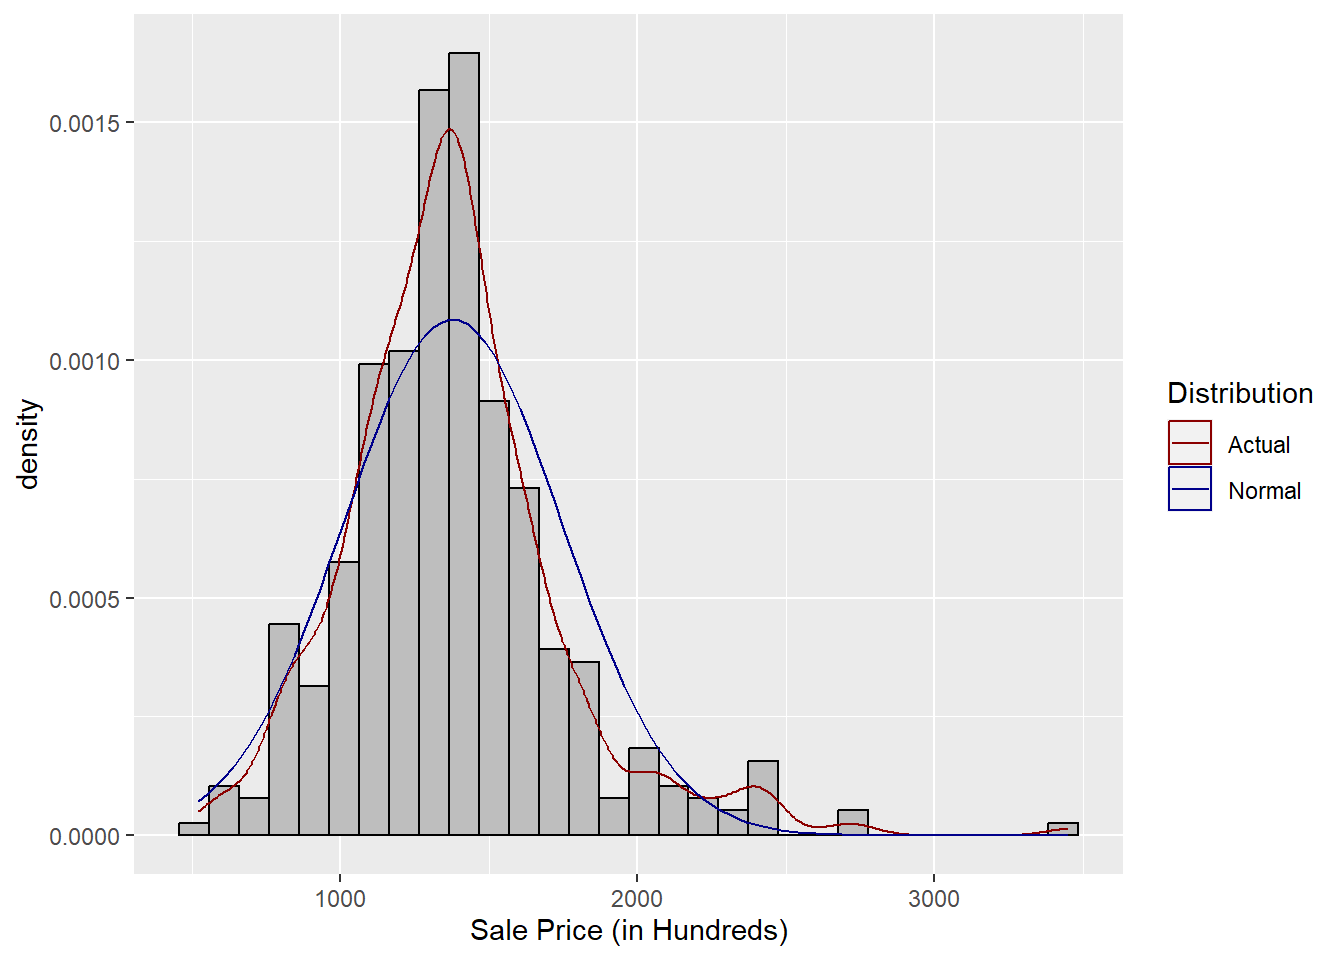
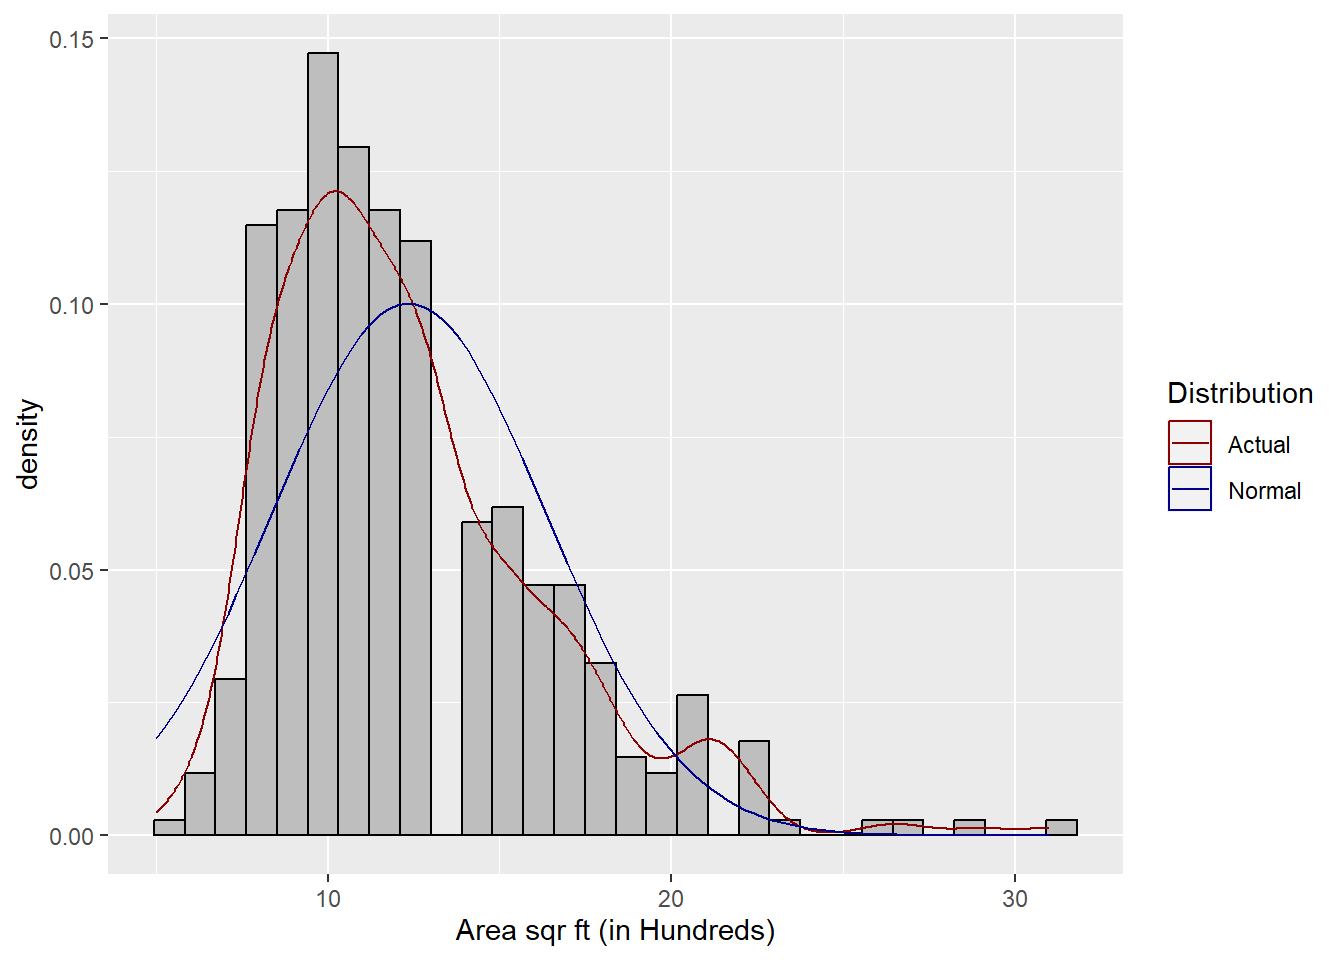
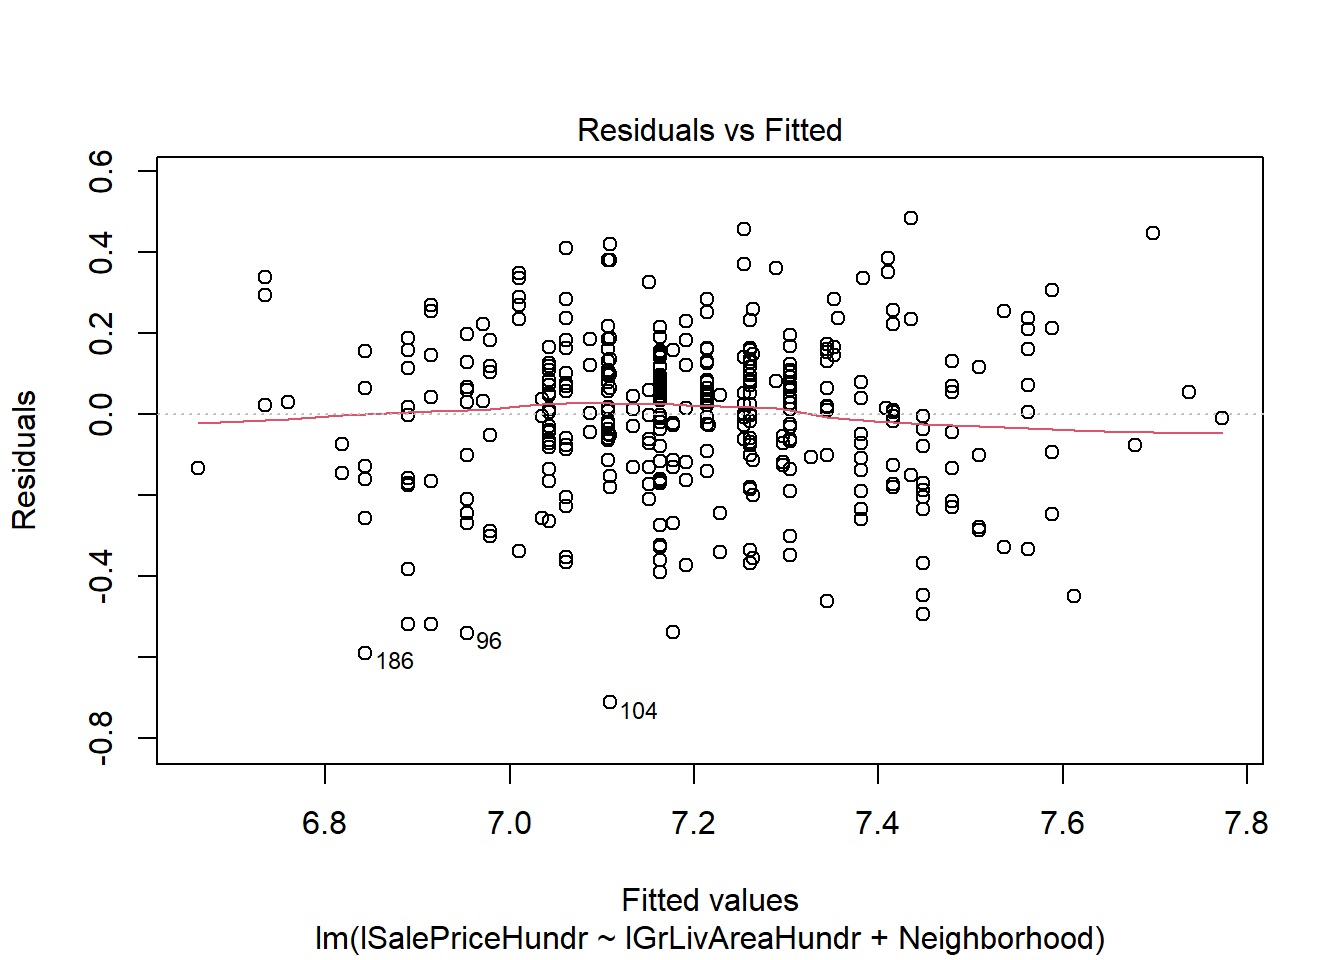
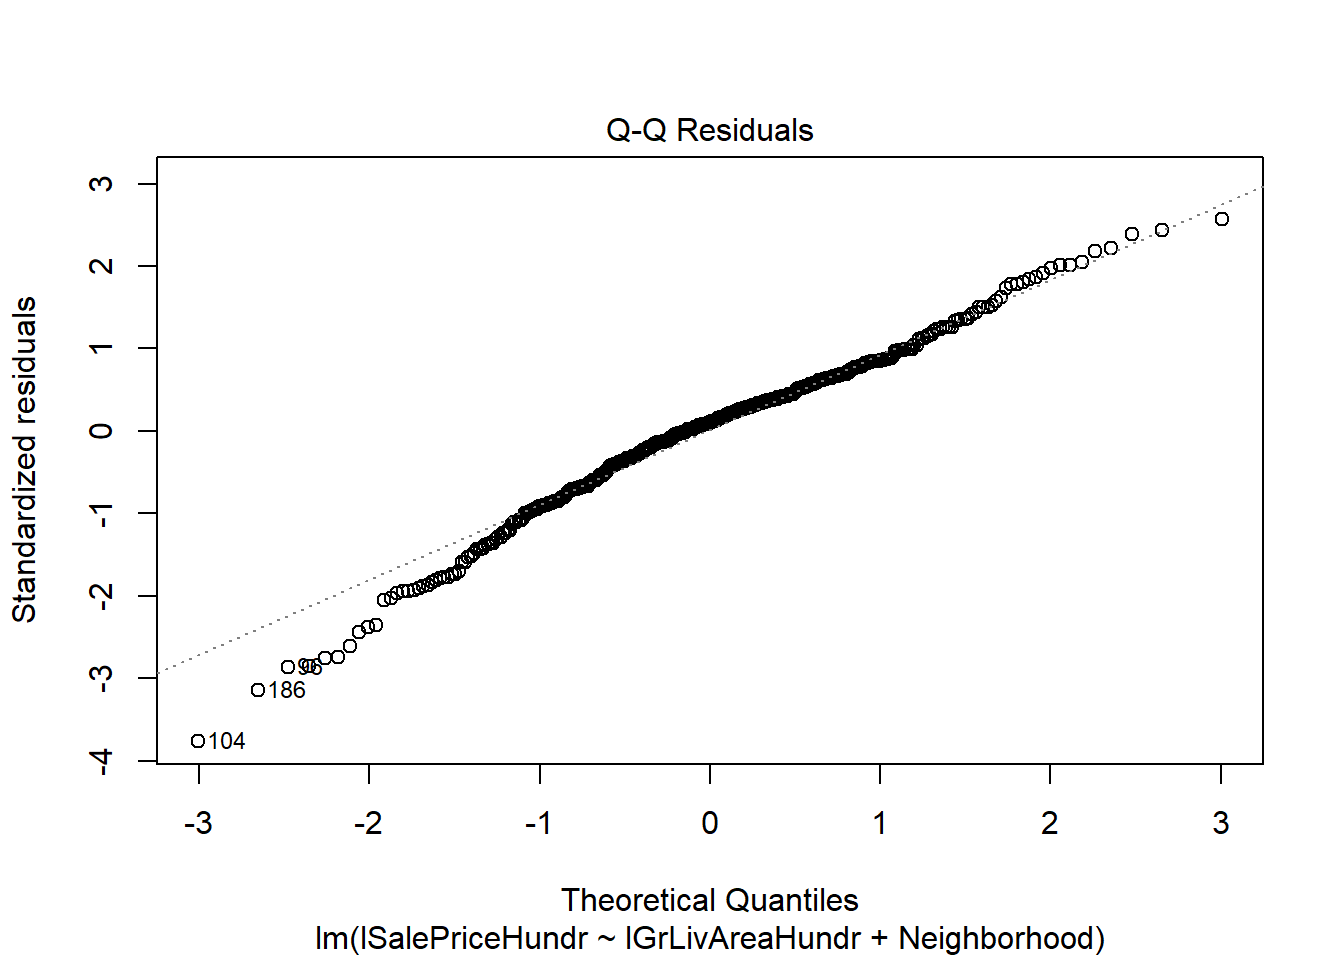
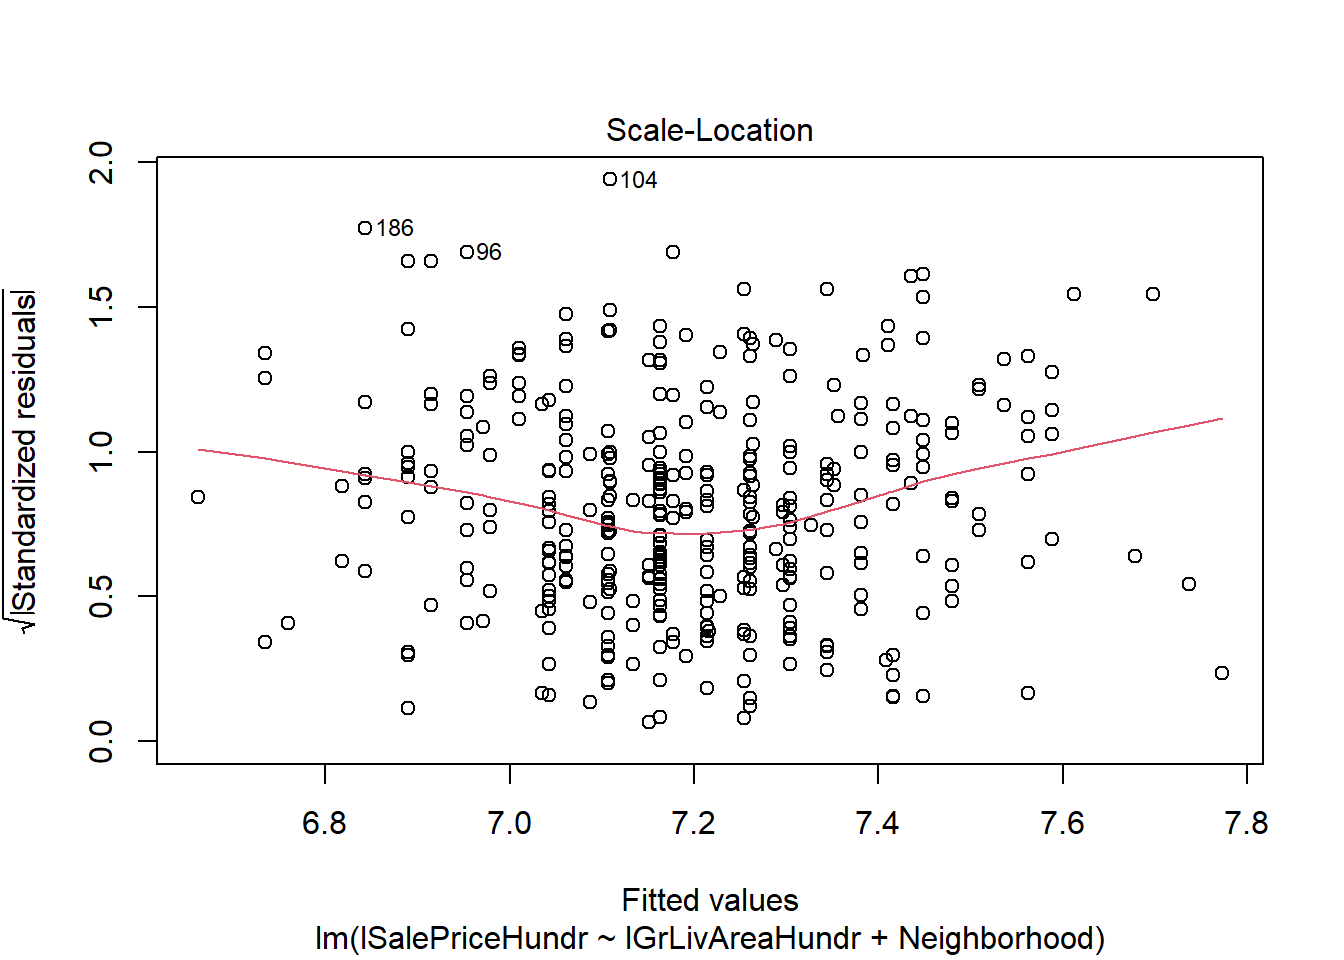
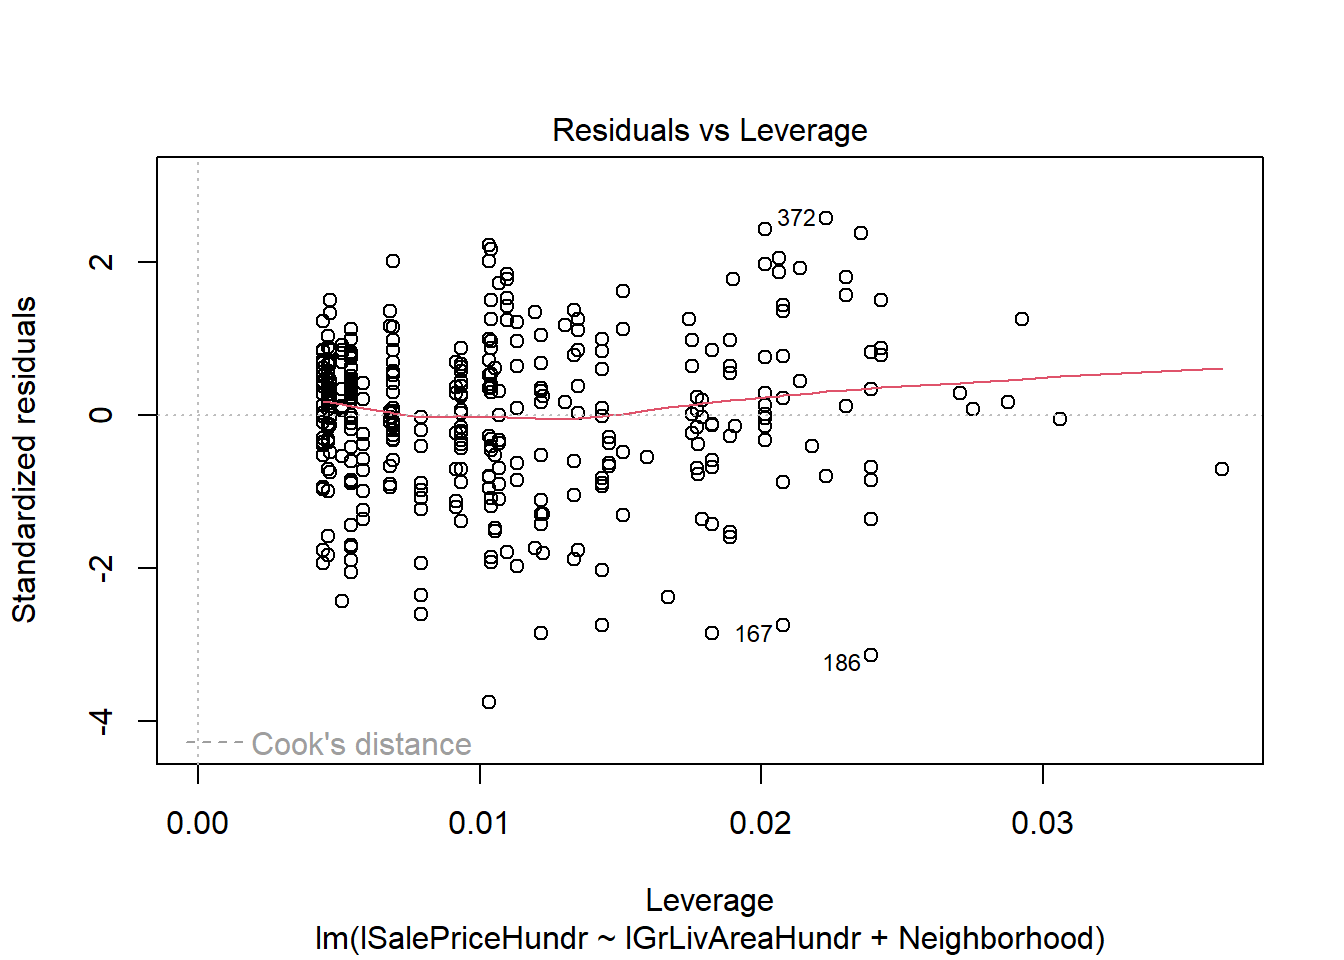
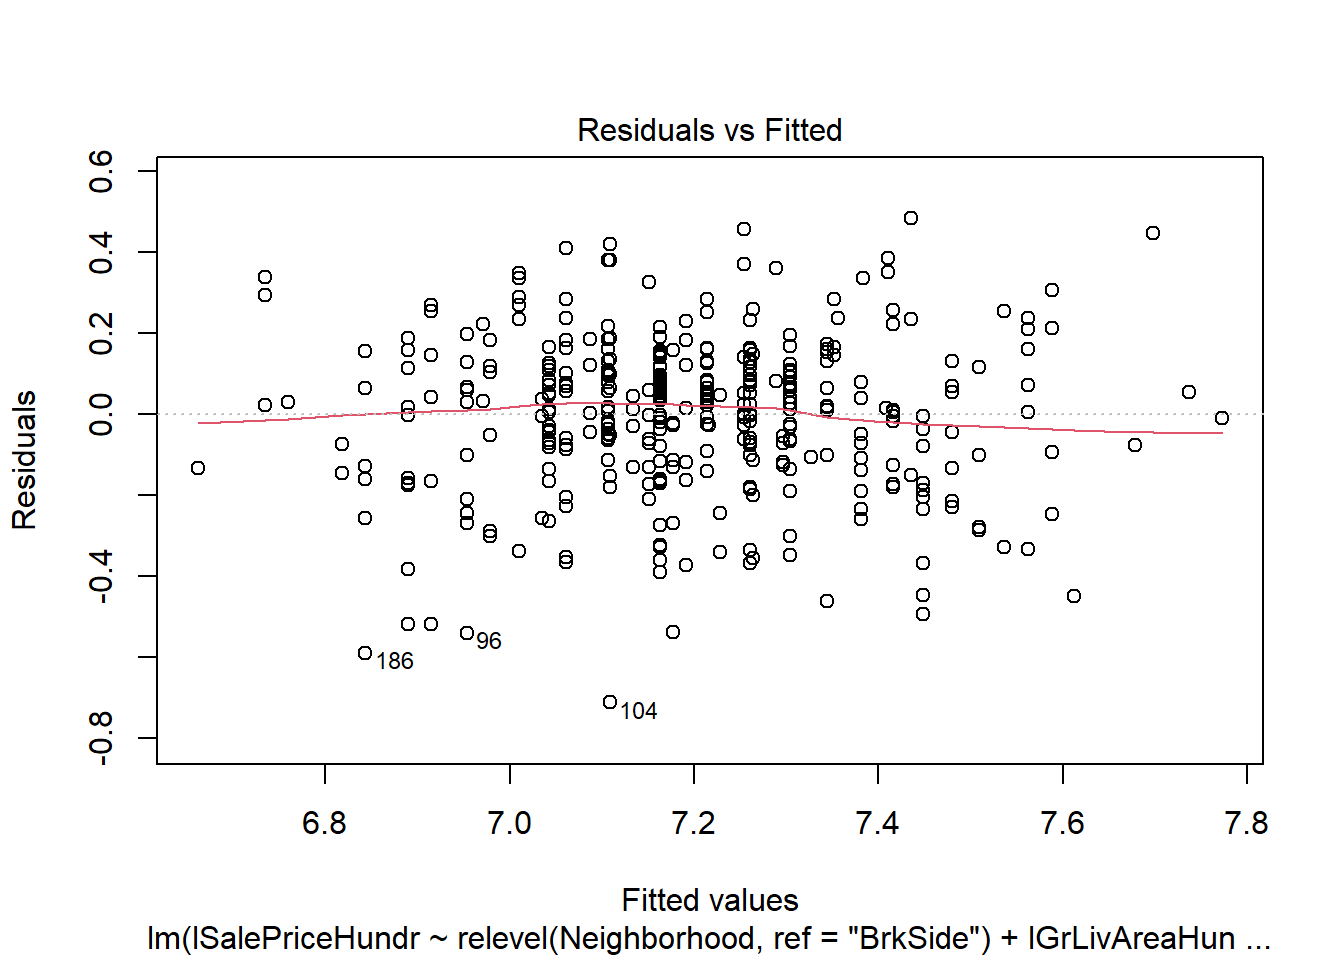
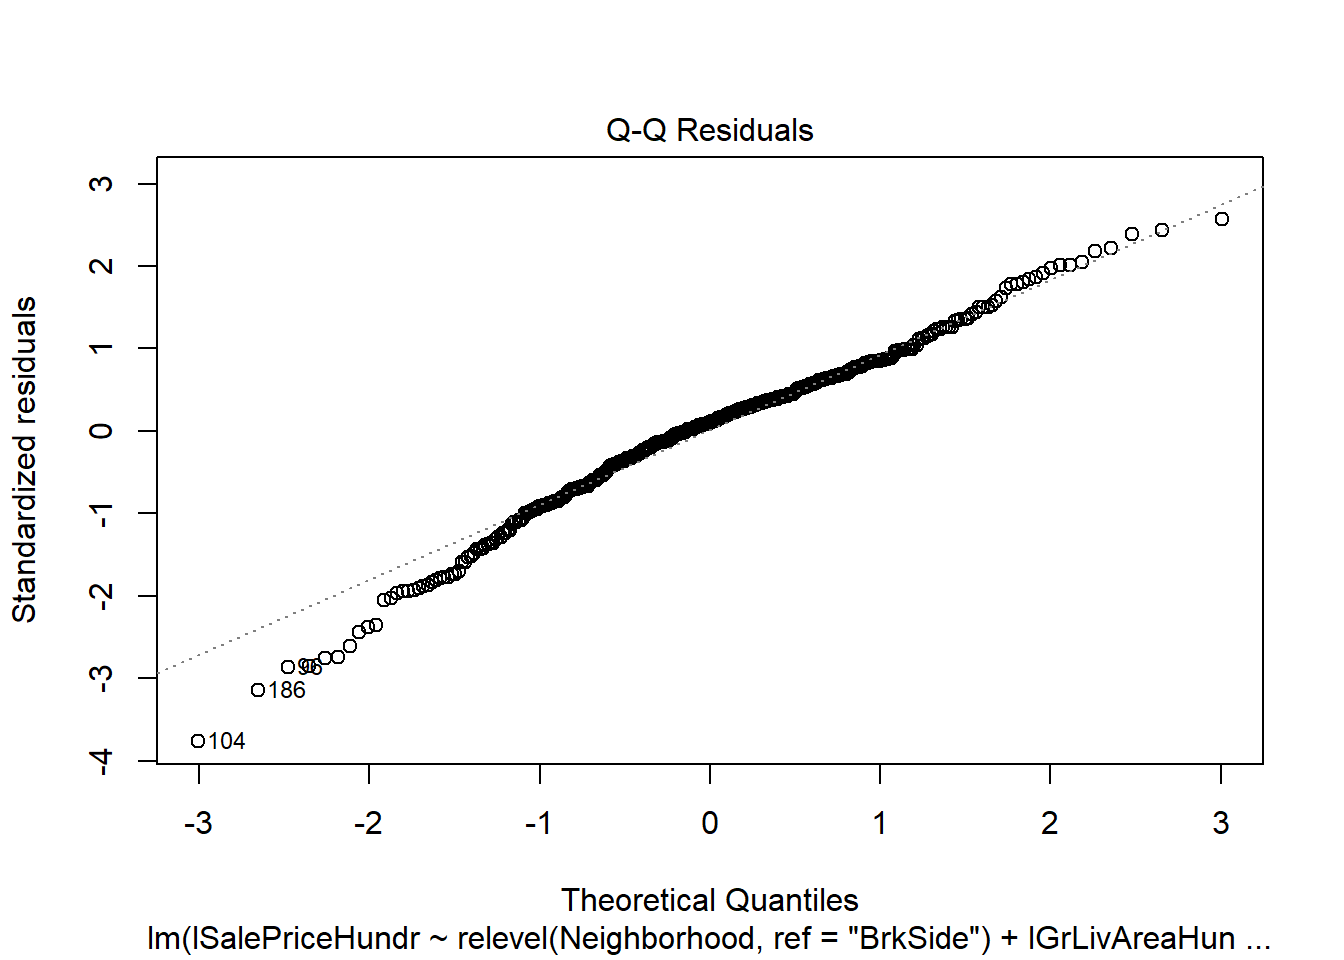
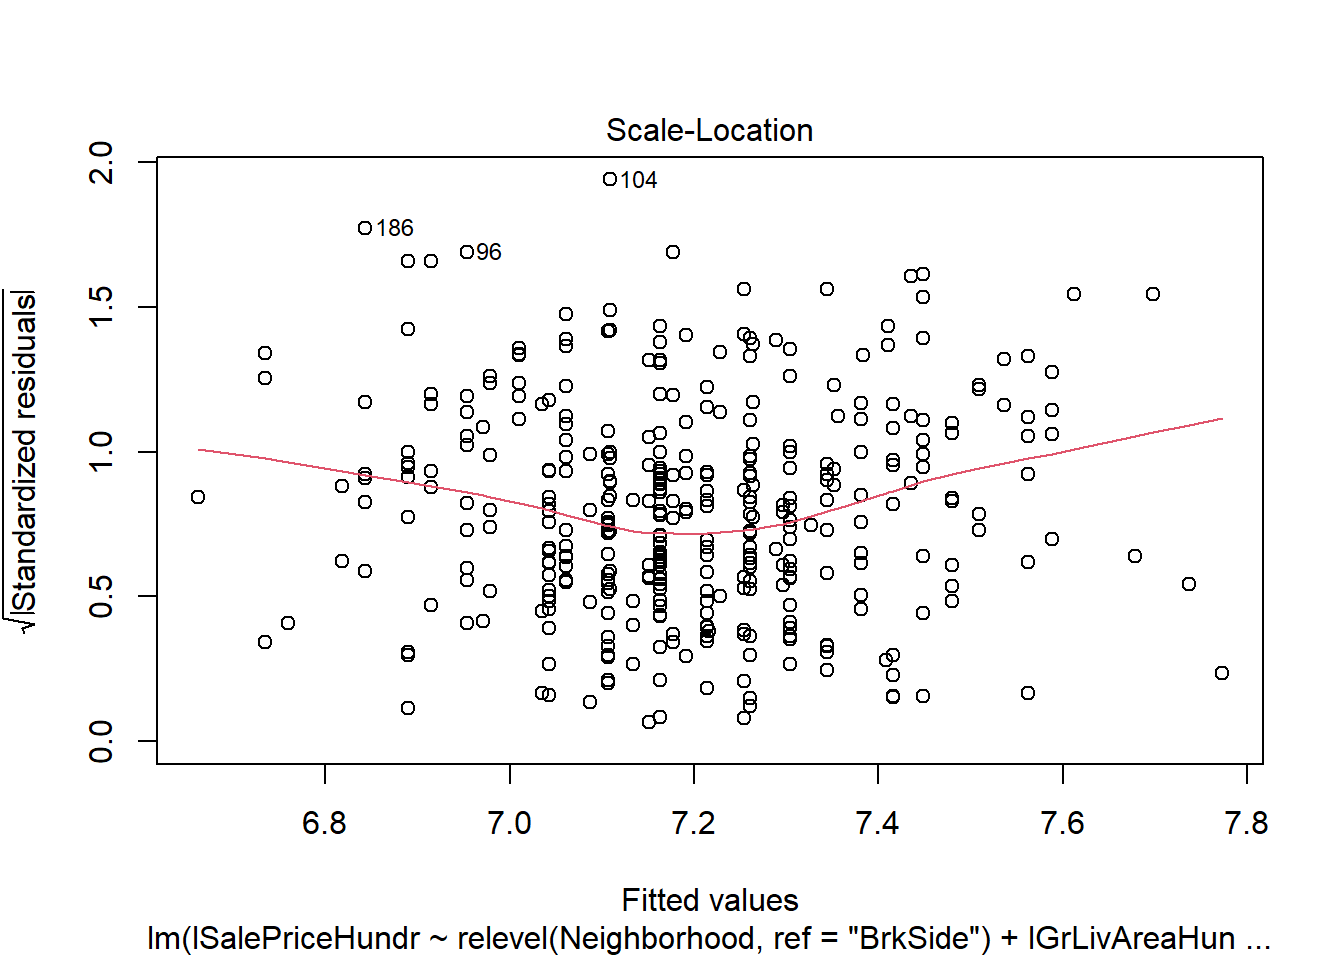
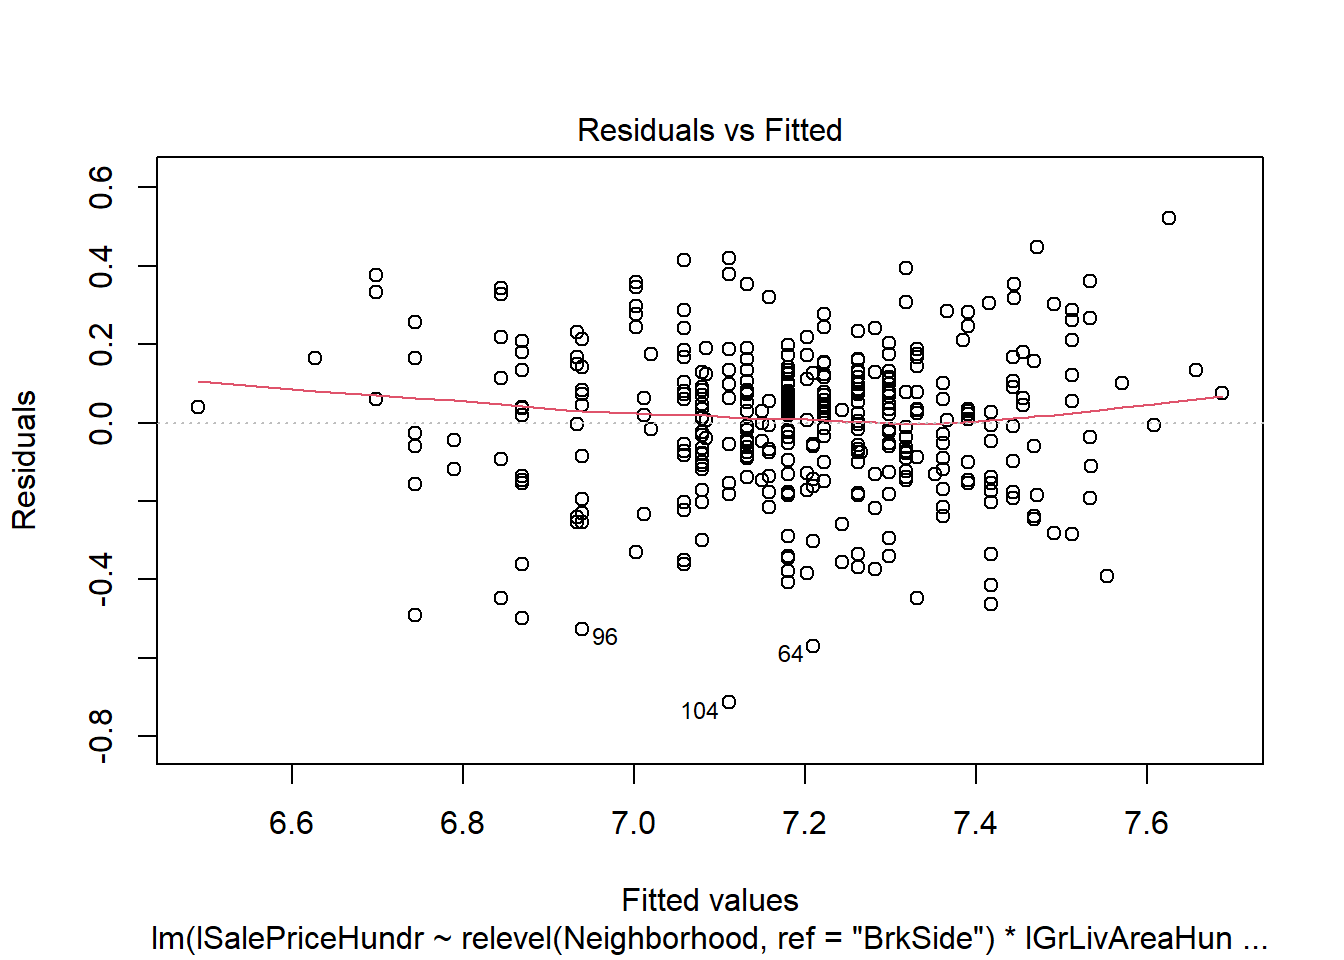
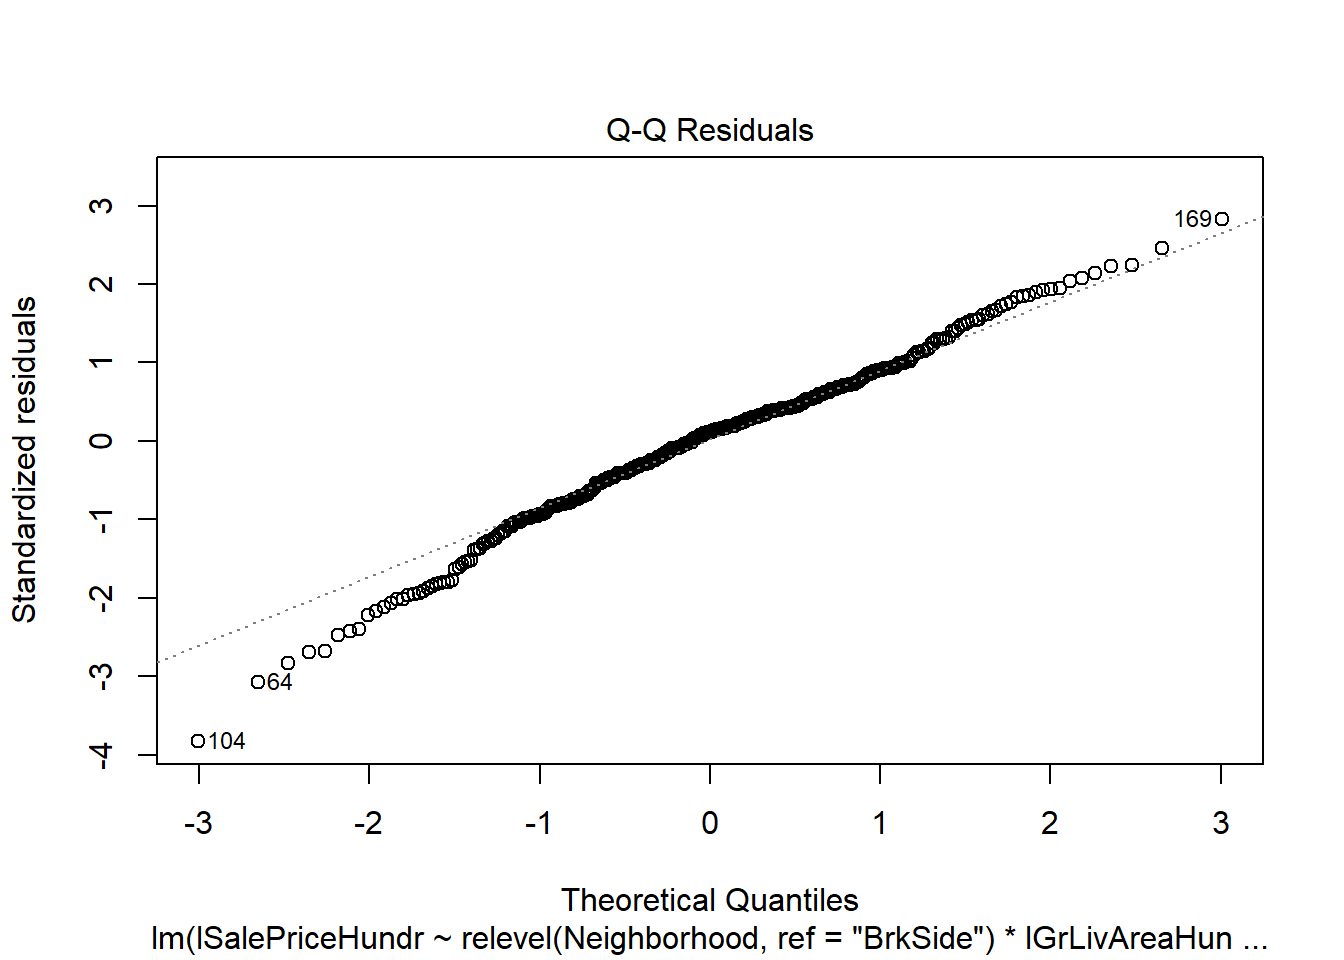
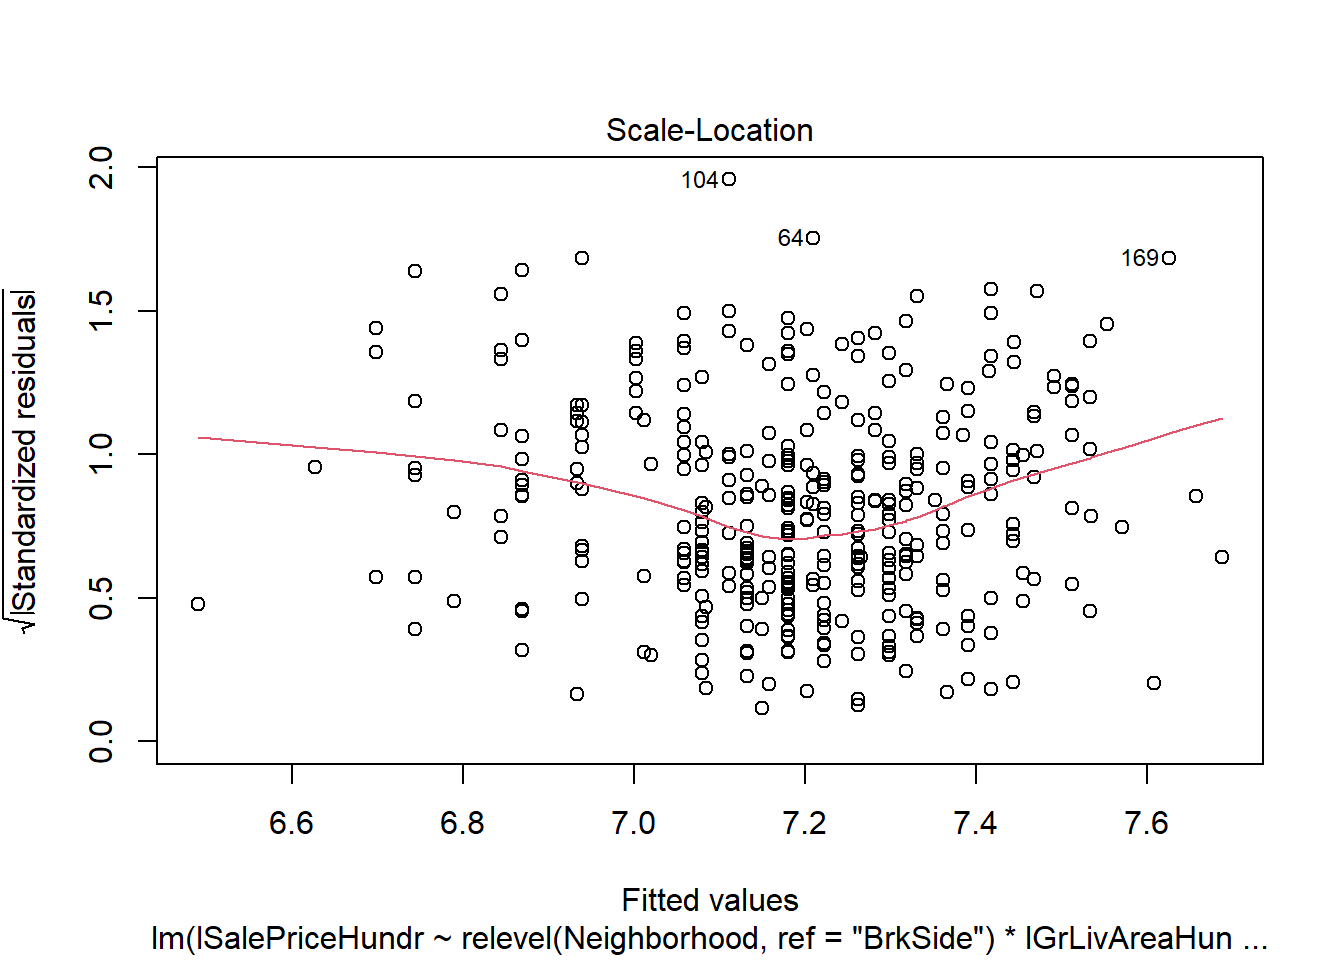
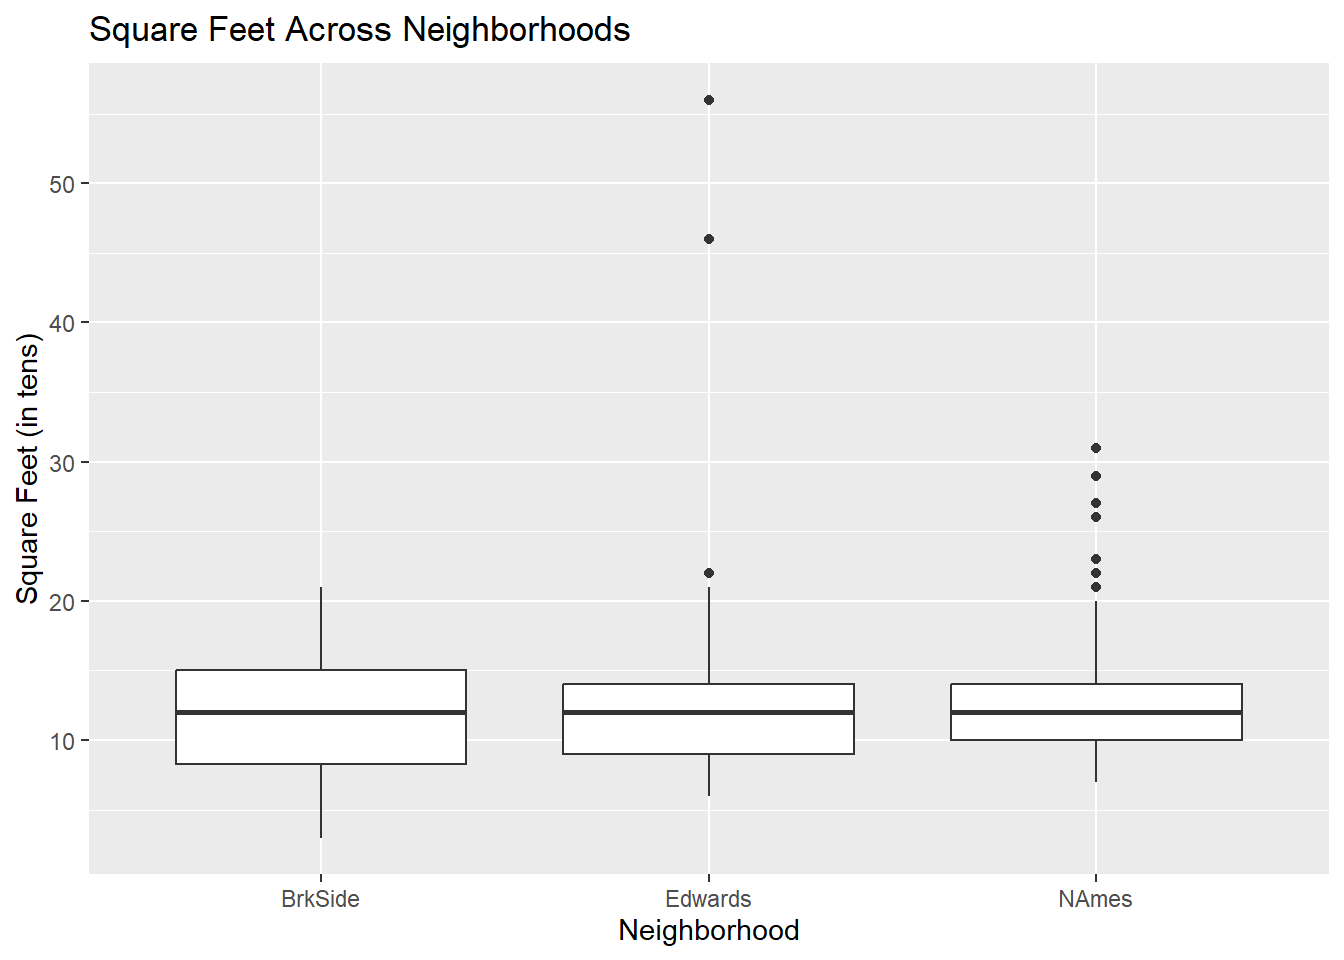 # Since the is some right skewedness and variables that are leveraging
the3 regression - look at the outliers
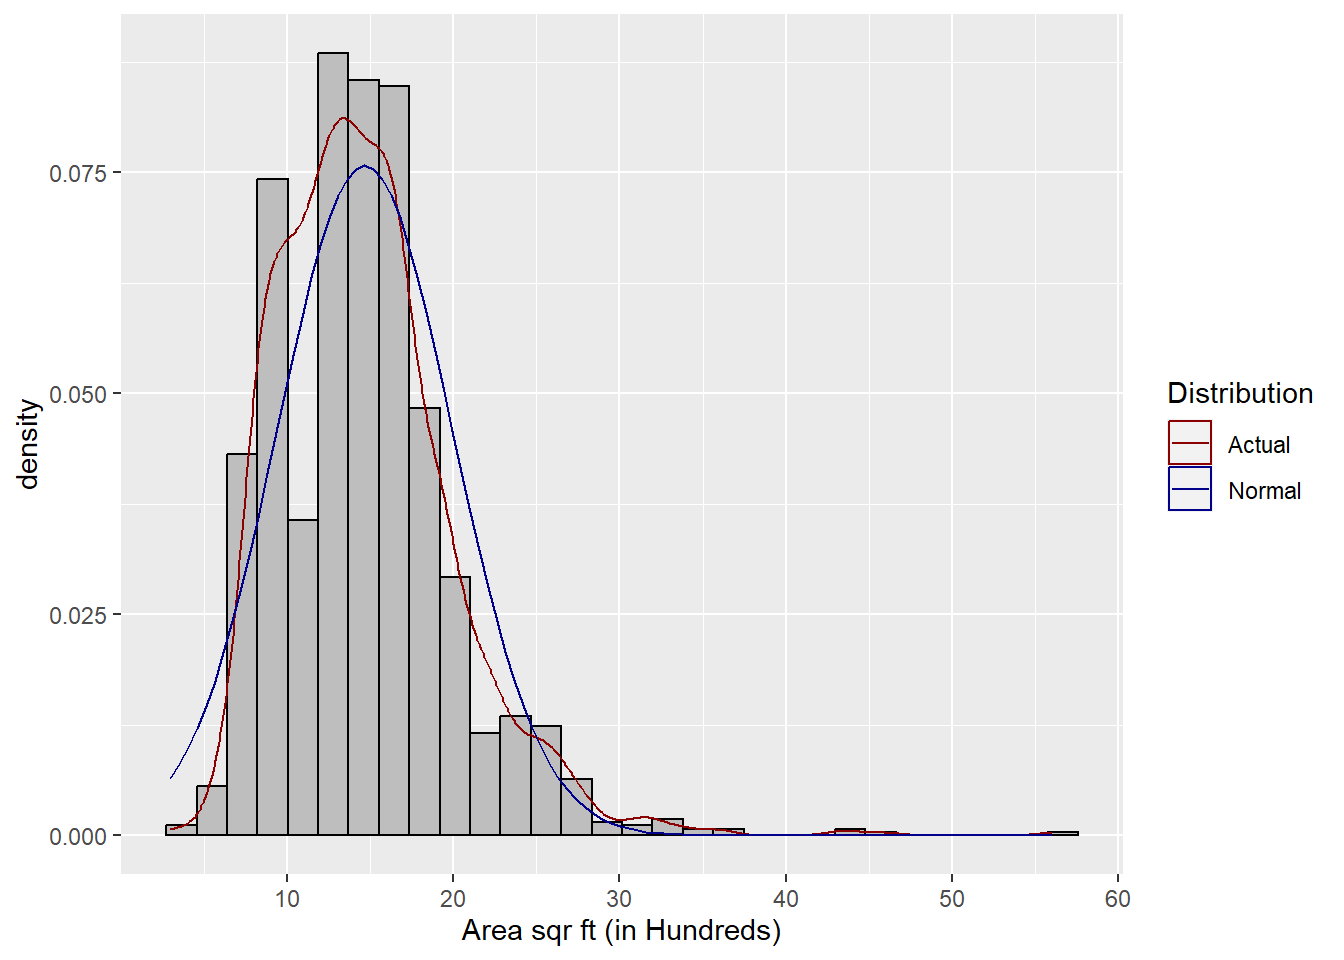
# Since the is some right skewedness and variables that are leveraging
the3 regression - look at the outliers